

Question: The data in Table 10.P2 are from a batch experiment measuring the distribution of octanoic acid between an aqueous phase consisting of a solution of
The data in Table 10.P2 are from a batch experiment measuring the distribution of octanoic acid between an aqueous phase consisting of a solution of corn syrup in water and an organic xylene phase. The aqueous phase was continuous, and the concentration in the aqueous phase was measured with a calibrated conductivity probe. Initially, 2 L of the aqueous phase was placed in a tank with 0.2 L of xylene and agitated until the drop size of the dispersed organic phase had equilibrated. 0.25 L of an aqueous phase containing octanoic acid was then added and the concentration in the continuous phase was recorded as a function of time. Determine Kma and compare to the value of 75 cm3/s reported by the authors of the original article.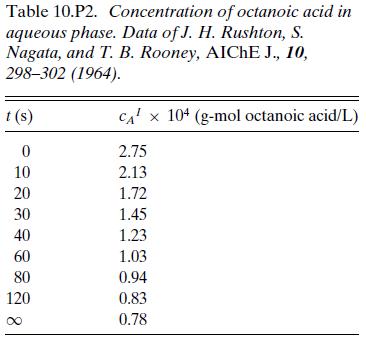
Table 10.P2. Concentration of octanoic acid in aqueous phase. Data of J. H. Rushton, S. Nagata, and T. B. Rooney, AICHE J., 10, 298-302 (1964). t (s) 0 10 20 30 40 60 80 120 CA x 104 (g-mol octanoic acid/L) 2.75 2.13 1.72 1.45 1.23 1.03 0.94 0.83 0.78
Step by Step Solution
3.52 Rating (152 Votes )
There are 3 Steps involved in it
The amount of octanoic acid in the aqueous phase at time t is represented by the formula C A The ini... View full answer

Get step-by-step solutions from verified subject matter experts