

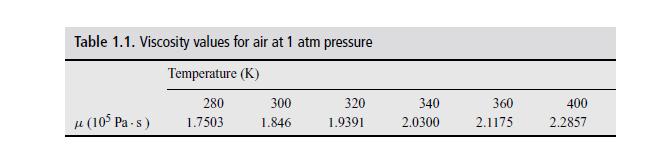
Viscosity data for air as a function of temperature are shown in Table 1.1. Fit a power-law
Question:
Viscosity data for air as a function of temperature are shown in Table 1.1. Fit a power-law model of the type
\[\mu=A T^{n}\]
to represent the data. Note that the viscosity of gases increases with increasing temperature, whereas that of liquids decreases.
Fantastic news! We've Found the answer you've been seeking!
Step by Step Answer:

Answered By
Utsab mitra
I have the expertise to deliver these subjects to college and higher-level students. The services would involve only solving assignments, homework help, and others.
I have experience in delivering these subjects for the last 6 years on a freelancing basis in different companies around the globe. I am CMA certified and CGMA UK. I have professional experience of 18 years in the industry involved in the manufacturing company and IT implementation experience of over 12 years.
I have delivered this help to students effortlessly, which is essential to give the students a good grade in their studies.
2+ Reviews
10+ Question Solved
Related Book For 
Advanced Transport Phenomena Analysis Modeling And Computations
ISBN: 9780521762618
1st Edition
Authors: P. A. Ramachandran
Question Posted:
