

(a) From the graph of Maxwell distribution of speeds in Fig. 3D.6, find the location that represents...
Question:
(a) From the graph of Maxwell distribution of speeds in Fig. 3D.6, find the location that represents the most probable speed of the molecules at each temperature.
(b) What happens to the fraction of molecules having a speed in the narrow range Δv centered on the most probable speed, vmp, as the temperature increases (Eq. 8)?
Fig. 3D.6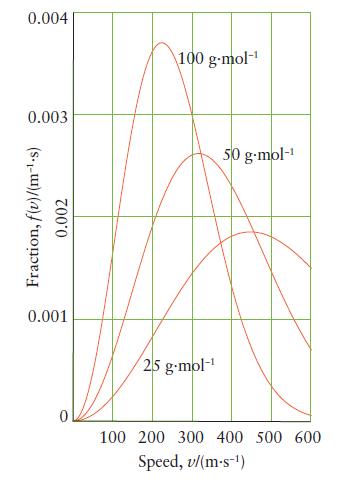

Fantastic news! We've Found the answer you've been seeking!
Step by Step Answer:
a The most probable speed is the one t...View the full answer

Answered By
GEORGE ODONGO
I have more than a year of tutoring online and back when I was in college, I also tutor lower year students. I often receive good reviews on my submitted answers.
0 Reviews
10+ Question Solved
Related Book For 
Chemical Principles The Quest For Insight
ISBN: 9781464183959
7th Edition
Authors: Peter Atkins, Loretta Jones, Leroy Laverman
Question Posted:
