

An RTD analysis was carried out on a liquid-phase reactor (Chem. Eng. J. 1, 76 (1970)). Analyze
Question:
An RTD analysis was carried out on a liquid-phase reactor (Chem. Eng. J. 1, 76 (1970)). Analyze the following data: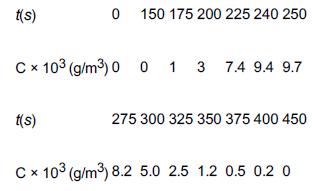
a. Plot the E(t) curve for these data.
b. What fraction of the material spends between 230 and 270 seconds in the reactor?
c. Plot the F(t) curve for these data.
d. What fraction of the material spends less than 250 seconds in the reactor?
e. What is the mean residence time?
f. What is the variance σ2?
g. Plot E(Θ) and F(Θ) as a function of Θ.
Fantastic news! We've Found the answer you've been seeking!
Step by Step Answer:
a Ct curve is given by b c d The fraction spe...View the full answer

Answered By
Utsab mitra
I have the expertise to deliver these subjects to college and higher-level students. The services would involve only solving assignments, homework help, and others.
I have experience in delivering these subjects for the last 6 years on a freelancing basis in different companies around the globe. I am CMA certified and CGMA UK. I have professional experience of 18 years in the industry involved in the manufacturing company and IT implementation experience of over 12 years.
I have delivered this help to students effortlessly, which is essential to give the students a good grade in their studies.
2+ Reviews
10+ Question Solved
Related Book For 

Question Posted:
