

Schematic diagrams of the Los Angeles basin are shown in Figure P1-2B. The basin floor covers approximately
Question:
Schematic diagrams of the Los Angeles basin are shown in Figure P1-2B. The basin floor covers approximately 700 square miles (2 × 1010 ft2) and is almost completely surrounded by mountain ranges. If one assumes an inversion height in the basin of 2,000 ft, the corresponding volume of air in the basin is 4 × 1013 ft3. We shall use this system volume to model the accumulation and depletion of air pollutants. As a very rough first approximation, we shall treat the Los Angeles basin as a well-mixed container (analogous to a CSTR) in which there are no spatial variations in pollutant concentrations.
Figure P1-2B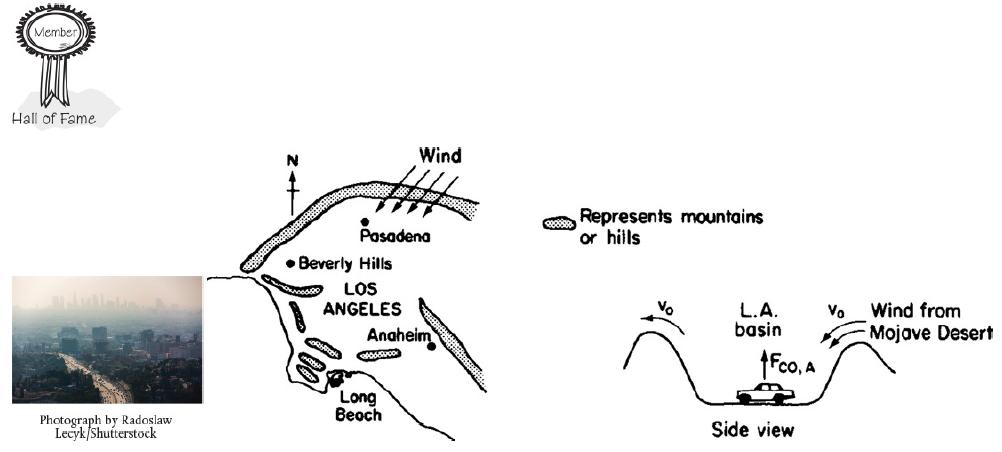
The first diagram displays the Los Angeles area surrounded by mountains or hills in the north and south. Beverly Hills and Pasadena are located to the north and long beach and Anaheim are present to the south of Los Angeles. The wind strikes in the south-west direction from the north of the Los Angels basin. The second diagram displays the side view of the Los Angels basin The wind moves from the Mojave desert in the right and moves toward the underlying Los Angeles basin. A car traveling in the direction of the wind is exerted by an upward force of F subscript CO, A. The rate of flow of the wind is v subscript 0 throughout. We shall perform an unsteady-state mole balance (Equation (1-4)) on CO as it is depleted from the basin area by a Santa Ana wind. Santa Ana winds are high-velocity winds that originate in the Mojave Desert just to the northeast of Los Angeles. Load the Smog in Los Angeles Basin Web Module. Use the data in the module to work parts 1–12
(a) through (h) given in the module. Load the Living Example Polymath code and explore the problem. For part (i), vary the parameters υ0, a, and b, and write a paragraph describing what you find. There is heavier traffic in the L.A. basin in the mornings and in the evenings as workers go to and from work in downtown L.A. Consequently, the flow of CO into the L.A. basin might be better represented by the sine function over a 24-hour period.
Step by Step Answer:
Given a Total number of lb moles gas in the system b Molar flowrate of CO into LA Basin b...View the full answer


