

Suggest a diagnosis (e.g., bypassing, dead volume, multiple mixing zones, internal circulation) for each of the following
Question:
Suggest a diagnosis (e.g., bypassing, dead volume, multiple mixing zones, internal circulation) for each of the following real reactors in Figure P16-2B (a) (1–10 curves) that had the following RTD [E(t), E(Θ), F(t), F(Θ) or (1 – F(Θ))] curves: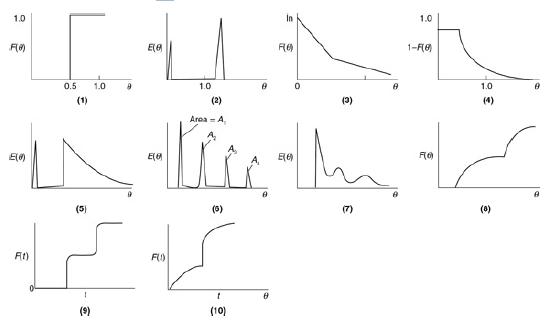
(a) RTD curves.
The first graph of F of theta versus theta shows a vertical line drawn from the point 0.5 of the horizontal axis that remains constant on reaching the value 1.0 of the vertical axis. The second graph of E of theta versus theta shows a line starting from the origin that increases to attain a minimum peak and further remains constant touching the horizontal axis. Again, the line increases and declines to attain a maximum peak. The third graph of F of theta versus theta shows a decreasing line that starts from the vertical axis at point In, decreases rapidly, takes a bend and further declines gradually near the horizontal axis. The fourth graph of 1 minus F of theta versus theta shows a line starting from the vertical axis. It remains constant for a while then decreases gradually touching the horizontal axis. The fifth graph of E of theta versus theta shows a line starting from the origin that gradually increases and declines to attain a minimum peak. Then, remains almost horizontal near the horizontal axis and inclines as a vertical line. From a point, it gradually declines. The sixth graph of E of theta versus theta shows a continuous curve with a sequence of peaks, with a maximum peak at the beginning that declines gradually with Area A subscript 1, A subscript 2, A subscript 3, and A subscript 4, respectively. The seventh graph of E of theta versus theta shows a vertical line that declines with two bumps. The eighth graph of F of theta versus theta shows an increasing curve with two bumps. The ninth graph of F of theta versus theta shows an increasing curve in a step-like manner. The tenth graph of F of theta versus theta shows an increasing curve from the origin that takes a bend and further inclines.
(b) Suggest a model (e.g., combinations of ideal reactors, bypassing) for each RTD function shown in Figure P16-2B(a) (1–10) that would give the RTD function. For example, for the real tubular reactor, whose E(Θ) curve is shown in Figure P16-2B (a) (5) above, the model is shown in Figure P16-2B (b) below. The real reactor is modeled as having bypassing, a back mix zone, and a PFR zone that mimics the real CSTR.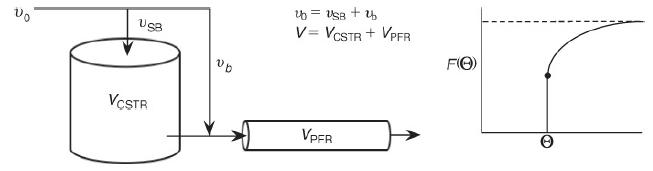
Real reactor modeled as CSTR and PFR with bypass. The figure shows a Continuous-Stirred Tank Reactor of volume V subscript CSTR and a Plug-Flow Reactor of volume V subscript PFR. The volumetric flow rate that enters the reactors represents v subscript 0. The volumetric flow rate that bypasses the CSTR and flows into the PFR tank is marked as v subscript b and the volumetric flow rate that enters the mixture in CSTR tank is marked as v subscript SB. Here, v subscript 0 equals v subscript SB plus v subscript b and volume V equals V subscript CSTR plus V subscript PFR. A graph plots F of theta as a function of theta. The curve initially extends vertically. That is, the F of theta value increases for a constant value of theta. Further, the F of theta value gradually increases with an increase in theta value.
Step by Step Answer:
a 1 PFR with dead volume 2 PFR with bypassing 3 Ideal CSTR in par...View the full answer


