

a. Example 16-1. What fraction of the fluid spends 9 minutes or longer in the reactor? What
Question:
a. Example 16-1. What fraction of the fluid spends 9 minutes or longer in the reactor? What fraction spends 2 minutes or less?
Example 16-1
A sample of the tracer hytane at 320 K was injected as a pulse into a reactor, and the effluent concentration was measured as a function of time, resulting in the data shown in Table E16-1.1. Pulse input
TABLE E16-1.1 TRACER DATA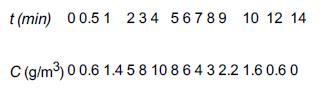
The measurements represent the exact concentrations at the times listed and not average values between the various sampling tests.
1. Construct a figure showing the tracer concentration C(t) as a function of time.
2. Construct a figure showing E(t) as a function of time.
b. Example 16-3. How would the E(t) change if the PFR space time, τp, was reduced by 50% and τs was increased by 50%? What fraction spends 2 minutes or less in the reactor?
Example 16-3
Examples of early and late mixing for a given RTD Consider a second-order reaction being carried out in a real CSTR that can be modeled as two different reactor systems: In the first system an ideal CSTR is followed by an ideal PFR; in the second system the PFR precedes the CSTR. To simplify the calculations, let τs and τp each equal 1 minute, let the reaction-rate constant equal 1.0 m3/kmol·min, and let the initial concentration of liquid reactant, CA0, equal 1.0 kmol/m3. Find the conversion in each system. For the parameters given, we note that in these two arrangements the RTD function, E(t), is the same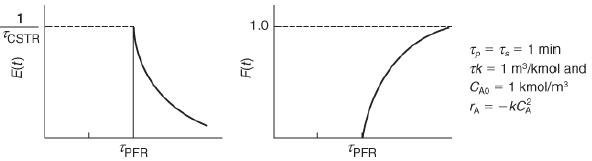
Two graphs are shown. In the first graph, the vertical axis represents E of t and the horizontal axis represents time. The graph plotted is concave upward decreasing curve. The curve starts at (tau subscript PFR, 1 over tau subscript CSTR) and decreases gradually. In the second graph, the vertical axis represents F of t and the horizontal axis represents time. The curve plotted starts at (tau subscript PFR, 0) and increases gradually to a maximum value of F(t) equals 1. Here, T subscript p equals T subscript s equals 1 minute, tau K equals 1 meter cubed over kilo mole, and C subscript A0 equals 1 kilo mole per meter cubed. Also, r subscript equals negative k times (C subscript A) squared.
Step by Step Answer:
a The area of a triangle ...View the full answer


