

The F-curves for two tubular reactors are shown in Figure P18-15B for a closed-closed system. The graph
Question:
The F-curves for two tubular reactors are shown in Figure P18-15B for a closed-closed system.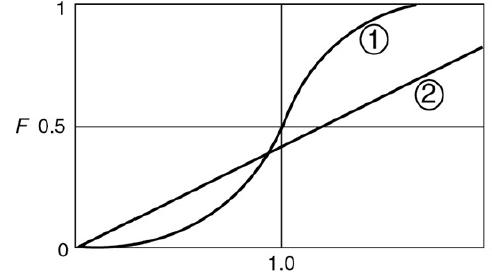
The graph shows the F-curves for reactors 1 and 2. The F value increases in both cases. Curve 1 is concave upward and increasing and reaches the F value of 0.5 when the value on the horizontal axis is 1. After this point, the curve is concave downward and increasing, till it reaches the F value of 1. Curve 2 is a straight line, where F value linearly increases from 0 to 0.7, approximately.
a. Which curve has the higher Péclet number? Explain.
b. Which curve has the higher dispersion coefficient? Explain.
c. If this F-curve is for the tanks-in-series model applied to two different reactors, which curve has the largest number of T-I-S, (1) or (2)?
Step by Step Answer:
a Higher Peclet number Curve 1 closer to the one of an ideal PFR has a higher Peclet n...View the full answer


