

The following E(t) curves were obtained from a tracer test on two tubular reactors in which dispersion
Question:
The following E(t) curves were obtained from a tracer test on two tubular reactors in which dispersion is believed to occur. A second-order reaction A→kBwithkCA0=0.2 min−1
is to be carried out in this reactor. There is no dispersion occurring either upstream or downstream of the reactor, but there is dispersion inside the reactor.
a. What is the final time t1 (in minutes) for the reactor shown in Figure P17-6B (a)? In Figure P17-6B (b)?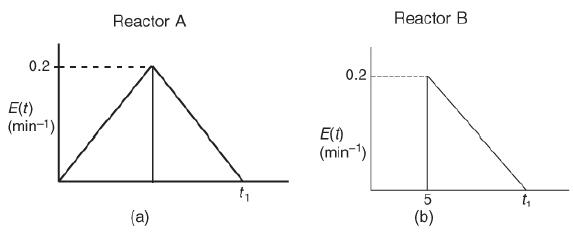
increases, reaches to a maximum value of 0.2, and decreases to 0. For reactor B, the value increases from 0 to 0.2 at t equals 5 and decreases linearly.
b. What is the mean residence time, tm, and variance, σ2, for the reactor shown in Figure P17-6B (a)? In Figure P17-6B (b)?
c. What is the fraction of the fluid that spends 7 minutes or longer in Figure P17-6B (a)? In Figure P17-6B (b)?
d. Find the conversion predicted by the segregation model for reactor A.
e. Find the conversion predicted by the maximum mixedness model for reactor A.
f. Find the conversion predicted by the T-I-S model for reactor A.
g. Repeat (d)–(f) for reactor B.
h. Now assume the reaction is first order with k1 = 0.2 min–1, what are the conversions predicted by the tanks-in-series, the segregation in the maximum mixedness model?
Step by Step Answer:
a From P165 a c b Mean residence time c Fraction of fluid spends lo...View the full answer


