

The following figures show the energy distribution function at 300 K for the reaction A + B
Question:
The following figures show the energy distribution function at 300 K for the reaction A + B → C.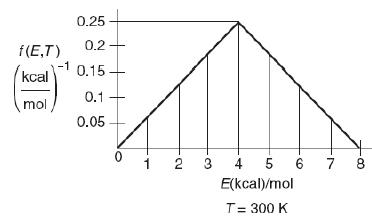
A graph of f (E, T) versus T is shown. The horizontal axis representing the energy (kilocalorie) per mole at temperature (equals 300 Kelvin) ranging from 0 to 8, in increments of 1. The vertical axis represents the f (E, T) in terms (kilocalorie per mole) superscript negative 1 ranging from 0.05 to 0.25, in increments of 0.05. The trend representing the f (E, T) is increasing until the energy 4 kilocalorie per mole, which then decreases steadily as the energy level drops. The f (E, T) at respective energy level is as follows: At energy 0- 0, 1- 0.05, 2- 0.11, 3- 0.17, 4- 0.25, 5- 0.17, 6- 0.11, 7- 0.05, and 8- 0.02.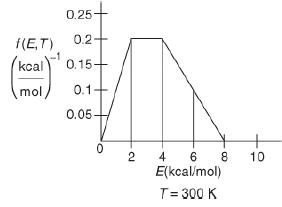
A graph of f (E, T) versus T is shown. The horizontal axis representing the energy (kilocalorie) per mole at temperature (equals 300 Kelvin) ranging from 0 to 8, in increments of 1. The vertical axis represents the f (E, T) in terms (kilocalorie per mole) superscript negative 1 ranging from 0.05 to 0.25, in increments of 0.05. The trend representing the f (E, T) is increasing until the energy 2 kilocalorie per mole, which then maintains a constant value at 4 kilocalories per mole, and then decreases steadily as the energy level drops. The f (E, T) at respective energy level is as follows: At energy 0- 0, 2- 0.2, 4- 0.2, 6- 0.1, and 8- 0.01. Note: the mentioned values are approximate. For each figure, determine the following:
a. What fraction of the collisions have energies between 3 and 5 kcal/mol?
b. What fraction of collisions have energies greater than 5 kcal/mol?
c. What is the fraction with energies greater than 0 kcal/mol?
d. What is the fraction with energies 8 kcal/mol or greater?
e. If the activation energy is 8 kcal/mol, what fraction of molecules have an energy greater than EA?
f. Guess what (sketch) the shape of the curve f(E,T) versus E shown in Figure P3-6(b) would look like if the temperature were increased to 400 K. (Remember:
∫0∞f(E,T)dE=1.).)
Step by Step Answer:
a The fraction of collisions having energy between E 3 and E 5 is the area under ...View the full answer


