

Tests were run on a small experimental reactor used for decomposing nitrogen oxides in an automobile exhaust
Question:
Tests were run on a small experimental reactor used for decomposing nitrogen oxides in an automobile exhaust stream. In one
series of tests, a nitrogen stream containing various concentrations of NO2 was fed to a reactor, and the kinetic data obtained are shown in Figure P7-11A. Each point represents one complete run. The reactor operates essentially as an isothermal backmix reactor (CSTR). What can you deduce about the apparent order of the reaction over the temperature range studied?
Figure P7-11A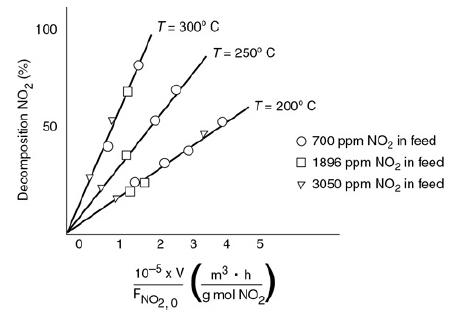
The trend graph shows the example of auto exhaust data. The horizontal axis representing 10 to the power negative 5 times V over F subscript NO2, 0 (m cubed times h over g moles NO2) ranging from 0 to 5 in unit increments. The vertical axis represents the percentage of Decomposition NO2 ranges from 0 to 100 in increments of 50. Three trend lines are drawn originating from the origin and extending across three different directions. The lines represent the temperature at 200 degrees Celsius, 250 degrees Celsius, and 300 degrees Celsius. Various points are marked on the lines that denote 700 parts per million of Nitrogen oxide in feed, 1896 parts per million of Nitrogen oxide in feed, and 3050 parts per million of Nitrogen oxide in feed. The line representing the temperature at 200 degree Celsius includes the plots of
different concentrations of Nitrogen dioxide in feed, (1, 15), (1.2, 16), (1.7, 16.5), (2, 25), (3, 40), (3.5, 48), and (40, 50.4). The line representing the temperature at 250 degrees Celsius includes the plots of different concentrations of Nitrogen dioxide in feed, (0.5, 20), (1.5, 40), (2, 50), and (2.6, 70). The line representing the temperature at 300 degrees Celsius includes the plots of different concentrations of Nitrogen dioxide in feed, (0.2, 25), (1, 50), (1.3, 68), and (1.5, 85).
The plot gives the fractional decomposition of NO2 fed versus the ratio of reactor volume V (in cm3) to the NO2 feed rate, FNO2.0 (g mol/h), at different feed concentrations of NO2 (in parts per million by weight). Determine as many rate-law parameters as you can.
Step by Step Answer:
Given Plot of percent decomposition of NO 2 vs VF A0 X Decomposition of NO2 ...View the full answer


