

Based on the phase diagram of CO 2 shown in Figure 12.39(b), describe the state changes that
Question:
Based on the phase diagram of CO2 shown in Figure 12.39(b), describe the state changes that occur when the temperature of CO2 is increased from 190 K to 350 K at a constant pressure of
(a) 1 atm,
(b) 5.1 atm,
(c) 10 atm, and
(d) 100 atm.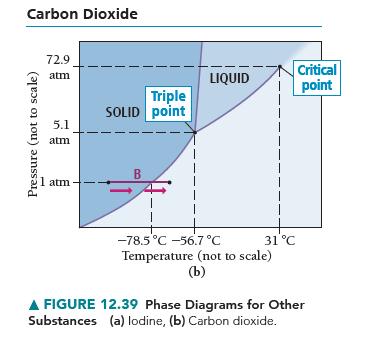
Fantastic news! We've Found the answer you've been seeking!
Step by Step Answer:
a CO s b CO s above 216 K c CO...View the full answer

Answered By
Muhammad Umair
I have done job as Embedded System Engineer for just four months but after it i have decided to open my own lab and to work on projects that i can launch my own product in market. I work on different softwares like Proteus, Mikroc to program Embedded Systems. My basic work is on Embedded Systems. I have skills in Autocad, Proteus, C++, C programming and i love to share these skills to other to enhance my knowledge too.
1+ Reviews
10+ Question Solved
Related Book For 

Question Posted:
