The density of a substance can change with temperature. The graph that follows displays the density of
Question:
The density of a substance can change with temperature. The graph that follows displays the density of water from -150 °C to 100 °C. Examine the graph and answer the questions.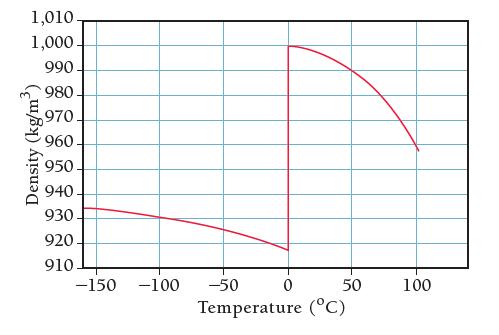
a. Water undergoes a large change in density at 0 °C as it freezes to form ice. Calculate the percent change in density that occurs when liquid water freezes to ice at 0 °C.![]()
b. Calculate the volume (in cm3) of 54 g of water at 1 °C and the volume of the same mass of ice at -1 °C. What is the change in volume?
c. Antarctica contains 26.5 million cubic kilometers of ice.
Assume the temperature of the ice is -20 °C. If all of this ice were heated to 1 °C and melted to form water, what volume of liquid water would form?
d. A 1.00-L sample of water is heated from 1 °C to 100 °C. What is the volume of the water after it is heated?
Step by Step Answer:
Question a The density of water increases as the temperature increases from 917 kgm at 150 C to 958 kgm at 100 C To calculate the percent change in de...View the full answer