

The infrared spectrum for methanol, CH 3 OH, is illustrated below. It shows the amount of light
Question:
The infrared spectrum for methanol, CH3OH, is illustrated below. It shows the amount of light in the infrared region that methanol transmits as a function of wavelength. The vertical axis is the amount of light transmitted. At points near the top of the graph, most of the incident light is being transmitted by the sample (or, conversely, little light is absorbed). Therefore, the “peaks” or “bands” that descend from the top indicate light absorbed; the longer the band, the more light is being absorbed. The horizontal scale is in units of “wavenumbers,” abbreviated cm−1. The energy of light is given by Planck’s law as E = hc/λ; that is, E is proportional to 1/λ. Therefore, the horizontal scale is in units of 1/λ and reflects the energy of the light incident on the sample.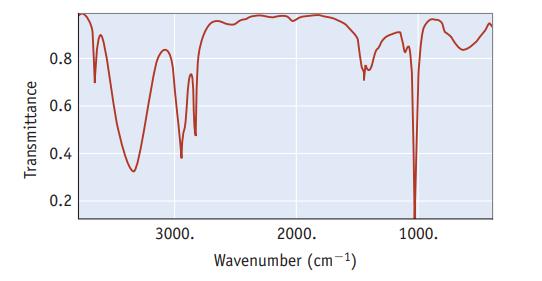
(a) One point on the horizontal axis is marked as 2000 cm−1. What is the wavelength of light at this point?
(b) Which is the low energy end of this spectrum (left or right), and which is the high energy end?
(c) The broad absorption at about 3300–3400 cm−1 indicates that infrared radiation is interacting with the OH group of the methanol molecule. The narrower absorptions around 2800–3000 cm−1 are for interactions with COH bonds. Which interaction requires more energy, with OOH or with COH?
Step by Step Answer:
Concerning the infrared spectrum for methanol a The ...View the full answer


Chemistry And Chemical Reactivity
ISBN: 9780357001172
10th Edition
Authors: John C. Kotz, Paul M. Treichel, John Townsend, David Treichel
