

The graphs below represent two plots of average speed of a gas versus the number of particles
Question:
The graphs below represent two plots of average speed of a gas versus the number of particles with that speed.
(a) If one plot is for argon and the other neon, which plot would be for neon?
(b) If both gases are the same, which plot represents the gas at a greater temperature?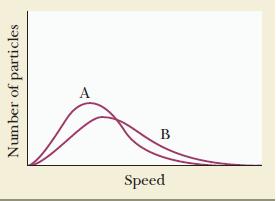
Fantastic news! We've Found the answer you've been seeking!
Step by Step Answer:
a...View the full answer

Answered By
Ashish Bhalla
I have 12 years work experience as Professor for Accounting, Finance and Business related subjects also working as Online Tutor from last 8 years with highly decentralized organizations. I had obtained a B.Com, M.Com, MBA (Finance & Marketing). My research interest areas are Banking Problem & Investment Management. I am highly articulate and effective communicator with excellent team-building and interpersonal skills; work well with individuals at all levels.
17+ Reviews
46+ Question Solved
Related Book For 
Chemistry Principles And Practice
ISBN: 9780534420123
3rd Edition
Authors: Daniel L. Reger, Scott R. Goode, David W. Ball
Question Posted:
