

The graph below shows the solubility of a salt as a function of pH. Which of the
Question:
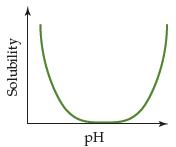
The graph below shows the solubility of a salt as a function of pH. Which of the following choices explain the shape of this graph?
(a) None; this behavior is not possible.
(b) A soluble salt reacts with acid to form a precipitate, and additional acid reacts with this product to dissolve it.
(c) A soluble salt forms an insoluble hydroxide, then additional base reacts with this product to dissolve it.
(d) The solubility of the salt increases with pH then decreases because of the heat generated from the neutralization reactions.
Fantastic news! We've Found the answer you've been seeking!
Step by Step Answer:
a Ionic product of sparingly soluble salt in its saturated solution is known as its solubility product Given MA M A K sp Solubility Product M A Now as ...View the full answer

Answered By
Ehsan Mahmood
I’ve earned Masters Degree in Business Studies and specialized in Accounts & Finance. Couple with this, I have earned BS Sociology from renowned institute of Pakistan. Moreover, I have humongous teaching experience at Graduate and Post-graduate level to Business and humanities students along with more than 7 years of teaching experience to my foreign students Online. I’m also professional writer and write for numerous academic journals pertaining to educational institutes periodically.
248+ Reviews
287+ Question Solved
Related Book For 

Chemistry The Central Science
ISBN: 9780321910417
13th Edition
Authors: Theodore E. Brown, H. Eugene LeMay, Bruce E. Bursten, Catherine Murphy, Patrick Woodward, Matthew E. Stoltzfus
Question Posted:
