

Question: Shown, again, is the scatter plot that indicates a relationship between the percentage of adult females in a country who are literate and the mortality
Shown, again, is the scatter plot that indicates a relationship between the percentage of adult females in a country who are literate and the mortality of children under five. Also shown is a line that passes through or near the points. Find a linear function that models the data by finding the slope-intercept form of the line’s equation. Use the function to make a prediction about child mortality based on the percentage of adult females in a country who are literate.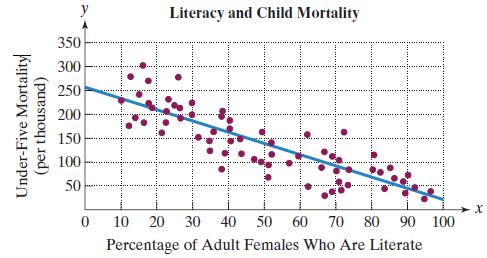
Under-Five Mortality (per thousand) 350 300 250 200 150 100 50 0 Literacy and Child Mortality 20 30 40 50 60 70 80 90 100 10 Percentage of Adult Females Who Are Literate X
Step by Step Solution
3.39 Rating (161 Votes )
There are 3 Steps involved in it
10 230 60 110 Poi... View full answer

Get step-by-step solutions from verified subject matter experts