

Question: Shown to the right is a scatter plot that indicates a relationship between the percentage of adult females in a country who are literate and
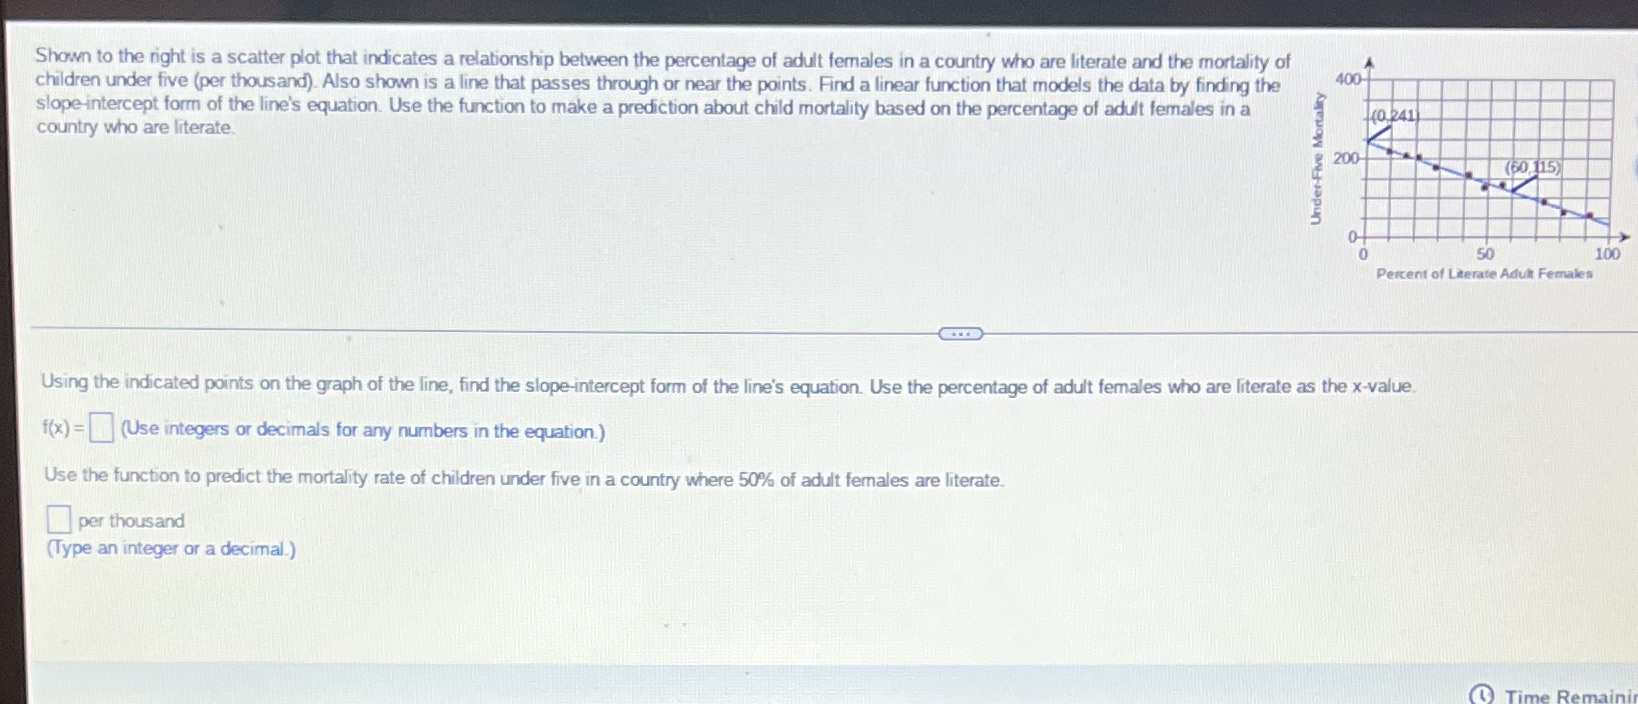
Shown to the right is a scatter plot that indicates a relationship between the percentage of adult females in a country who are literate and the mortality of children under five (per thousand). Also shown is a line that passes through or near the points. Find a linear function that models the data by finding the 400 slope-intercept form of the line's equation. Use the function to make a prediction about child mortality based on the percentage of adult females in a 10 241 country who are literate. Under Five Mortality 200 (60 115) 50 100 Percent of Literate Adult Females Using the indicated points on the graph of the line, find the slope-intercept form of the line's equation. Use the percentage of adult females who are literate as the x-value f(x) =(Use integers or decimals for any numbers in the equation.) Use the function to predict the mortality rate of children under five in a country where 50% of adult females are literate. per thousand (Type an integer or a decimal.) Time Remaini
Step by Step Solution
There are 3 Steps involved in it

Get step-by-step solutions from verified subject matter experts