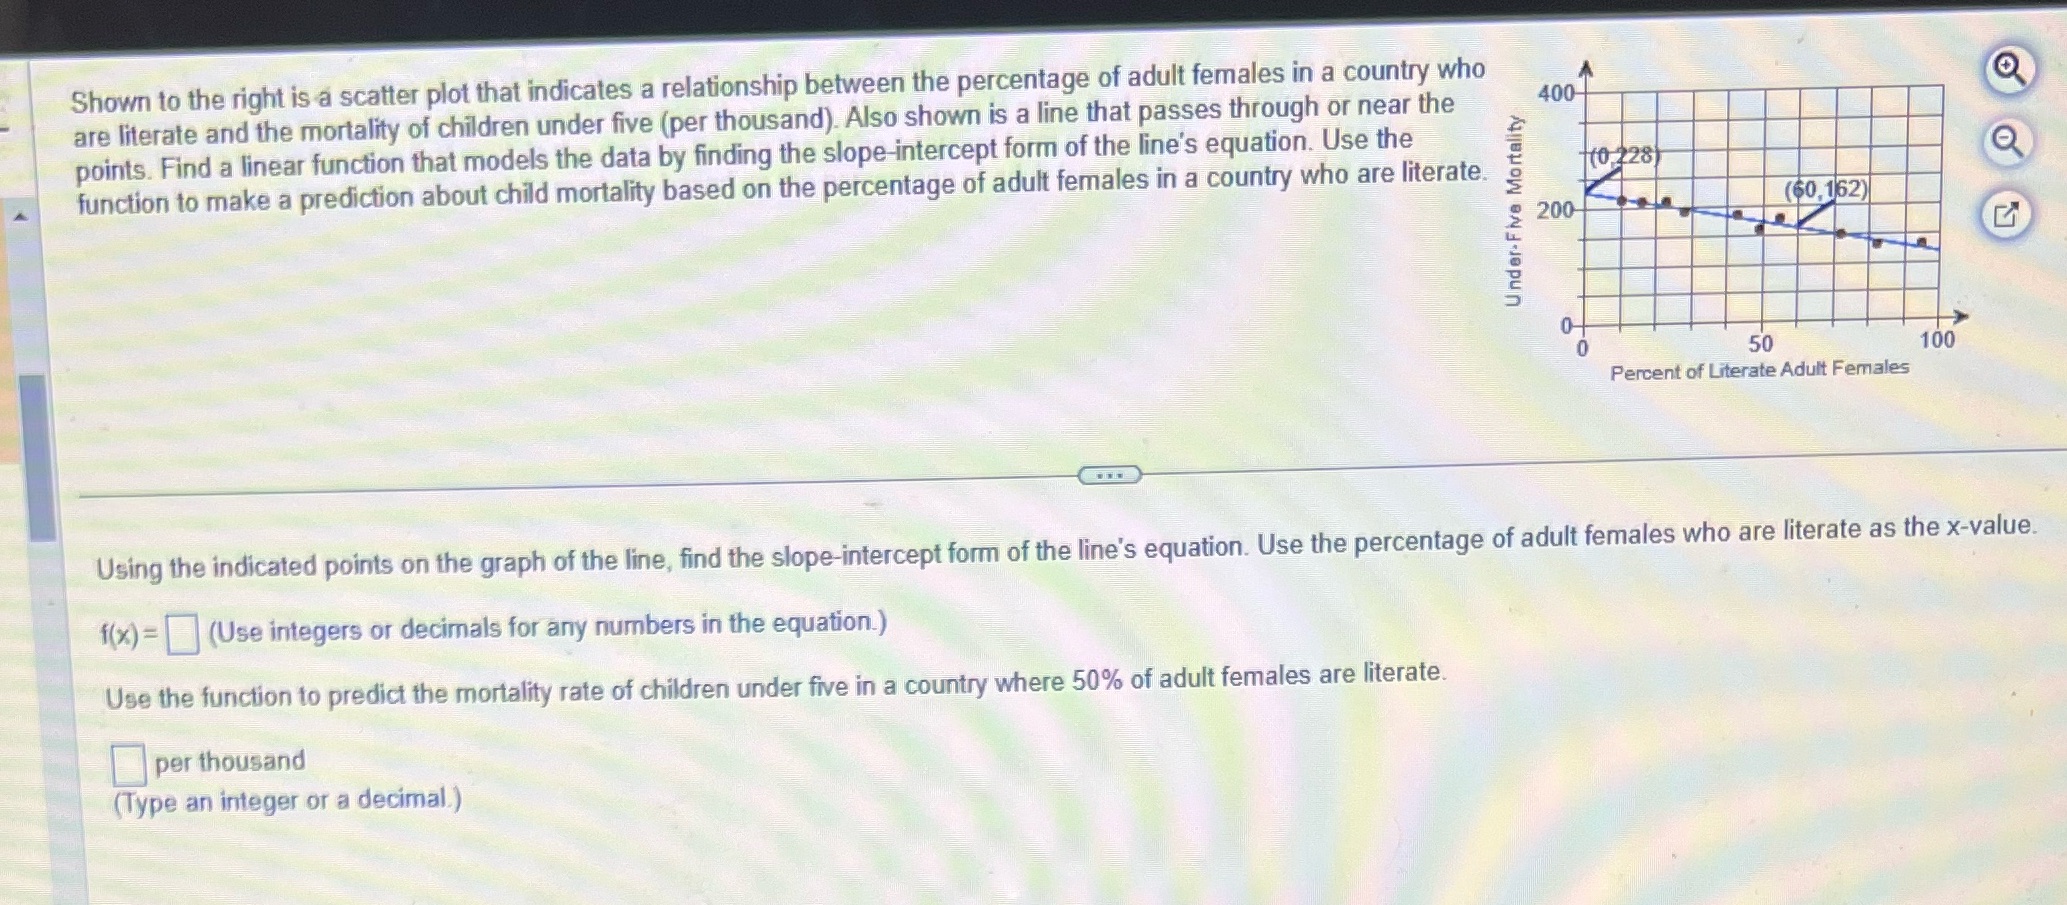
Question: Shown to the right is a scatter plot that indicates a relationship between the percentage of adult females in a country who are literate and

Shown to the right is a scatter plot that
Shown to the right is a scatter plot that indicates a relationship between the percentage of adult females in a country who are literate and the mortality of children under five (per thousand). Also shown is a line that passes through or near the 400- points. Find a linear function that models the data by finding the slope intercept form of the line's equation. Use the function to make a prediction about child mortality based on the percentage of adult females in a country who are literate. 10 228 200 (60,152) Under-Five Mortality 50 100 Percent of Literate Adult Females Using the indicated points on the graph of the line, find the slope-intercept form of the line's equation. Use the percentage of adult females who are literate as the x-value. f(x)= (Use integers or decimals for any numbers in the equation.) Use the function to predict the mortality rate of children under five in a country where 50% of adult females are literate. per thousand (Type an integer or a decimal.)

Step by Step Solution

There are 3 Steps involved in it

1 Expert Approved Answer
Step: 1 Unlock blur-text-image
Question Has Been Solved by an Expert!

Get step-by-step solutions from verified subject matter experts

Step: 2 Unlock
Step: 3 Unlock

Students Have Also Explored These Related Mathematics Questions!