

The bar graph at the top of the next column shows the average number of hours per
Question:
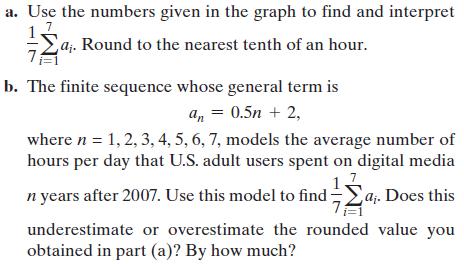
The bar graph at the top of the next column shows the average number of hours per day that U.S. adult users spent on digital media (desktop/laptop, mobile, and other devices) from 2008 through 2014.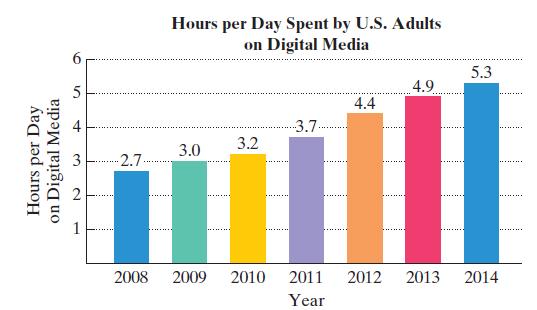
Let an represent the average number of hours per day that U.S. adult users spent on digital media n years after 2007.
Fantastic news! We've Found the answer you've been seeking!
Step by Step Answer:
a b 17127 ai 2730 73032374449...View the full answer

Answered By
Munibah Munir
I've done MS specialization in finance’s have command on accounting and financial management. Forecasting and Financial Statement Analysis is basic field of my specialization. On many firms I have done real base projects in financial management field special forecasting. I have served more than 500 Clients for more than 800 business projects, and I have got a very high repute in providing highly professional and quality services.I have capability of performing extra-ordinarily well in limited time and at reasonable fee. My clients are guaranteed full satisfaction and I make things easy for them. I am capable of handling complex issues in the mentioned areas and never let my clients down.
467+ Reviews
648+ Question Solved
Related Book For 

Question Posted:
