

The bar graph shows online ad spending worldwide, in billions of dollars, from 2010 through 2015. Develop
Question:
The bar graph shows online ad spending worldwide, in billions of dollars, from 2010 through 2015. Develop a linear function that models the data. Then use the function to make a projection about what might occur after 2015.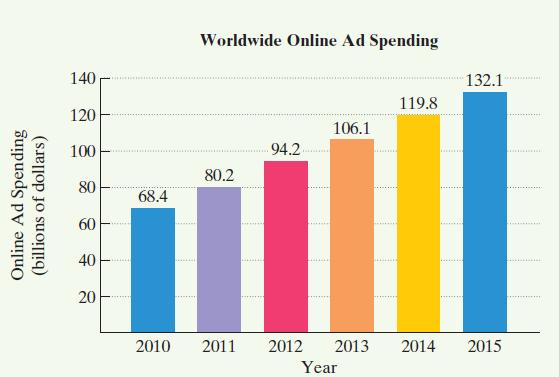
Fantastic news! We've Found the answer you've been seeking!
Step by Step Answer:
Let x represent the number of year...View the full answer

Answered By
Utsab mitra
I have the expertise to deliver these subjects to college and higher-level students. The services would involve only solving assignments, homework help, and others.
I have experience in delivering these subjects for the last 6 years on a freelancing basis in different companies around the globe. I am CMA certified and CGMA UK. I have professional experience of 18 years in the industry involved in the manufacturing company and IT implementation experience of over 12 years.
I have delivered this help to students effortlessly, which is essential to give the students a good grade in their studies.
2+ Reviews
10+ Question Solved
Related Book For 

Question Posted:
