

The figure shows the graph of y = f(x) and its two vertical asymptotes. Use the graph
Question:
The figure shows the graph of y = f(x) and its two vertical asymptotes. Use the graph to solve Exercises 1–10.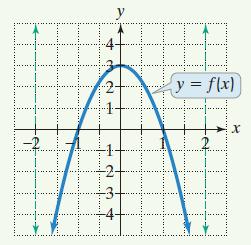
What is the relative maximum and where does it occur?
Fantastic news! We've Found the answer you've been seeking!
Step by Step Answer:
The relati...View the full answer

Answered By
Sagar Kumar
I am Mechanical Engineer with CGPA of 3.98 out of 4.00 from Pakistan. I went to Government Boys Degree College, Sehwan for high school studies.
I appeared in NUST Entrance Exam for admission in university and ranked #516. My mathematics are excellent and I have participated in many math competitions and also won many of them. Recently, I participated in International Youth Math Challenge and was awarded with Gold Honor. Now, I am also an ambassador at International Youth Math Challenge,
I have been teaching when I was in 9th class class year 2012. I have taught students from 6th class to university level.
1+ Reviews
10+ Question Solved
Related Book For 

Question Posted:
