

The graph depicts the distance y that a person driving a car on a straight road is
Question:
The graph depicts the distance y that a person driving a car on a straight road is from home after x hours. Interpret the graph. What speeds did the car travel?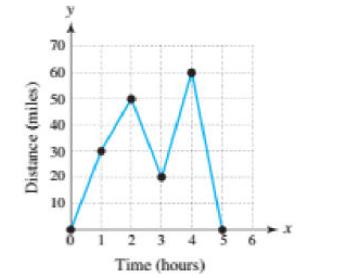
Fantastic news! We've Found the answer you've been seeking!
Step by Step Answer:
Since the graph is piecewise linear the slope each lin...View the full answer

Answered By
Divya Munir
I hold M.Sc and M.Phil degrees in mathematics from CCS University, India and also have a MS degree in information management from Asian institute of technology, Bangkok, Thailand. I have worked at a international school in Bangkok as a IT teacher. Presently, I am working from home as a online Math/Statistics tutor. I have more than 10 years of online tutoring experience. My students have always excelled in their studies.
0 Reviews
10+ Question Solved
Related Book For 

College Algebra With Modeling And Visualization
ISBN: 9780134418049
6th Edition
Authors: Gary Rockswold
Question Posted:
