

The graph of an inequality in two variables is a region in the rectangular coordinate system. Regions
Question:
The graph of an inequality in two variables is a region in the rectangular coordinate system. Regions in coordinate systems have numerous applications. For example, the regions in the following two graphs indicate whether a person is obese, overweight, borderline overweight, normal weight, or underweight.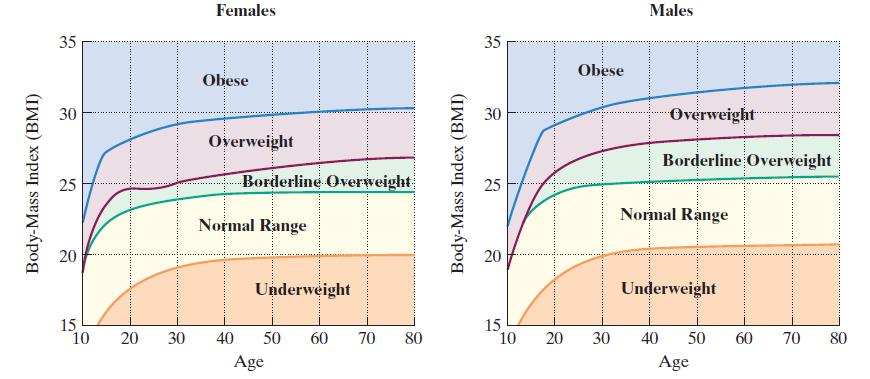 The horizontal axis shows a person’s age. The vertical axis shows that person’s body-mass index (BMI), computed using the following formula:
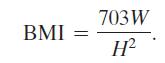
The variable W represents weight, in pounds. The variable H represents height, in inches. Use this information to solve Exercises 85–86.
A man is 20 years old, 72 inches (6 feet) tall, and weighs 200 pounds.
a. Compute the man’s BMI. Round to the nearest tenth.
b. Use the man’s age and his BMI to locate this information as a point in the coordinate system for males. Is this person obese, overweight, borderline overweight, normal weight, or underweight?
Step by Step Answer:
a b A 20 year old ...View the full answer


