

Question: Notice that the figure does not specify which graph is the model for dry roads and which is the model for wet roads. Use this
Notice that the figure does not specify which graph is the model for dry roads and which is the model for wet roads. Use this information to solve Exercises 77–78.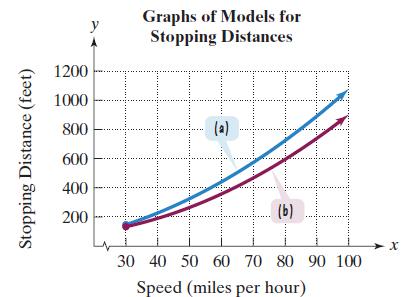 a. Use the given functions at the bottom of the shown below to find the stopping distance on dry pavement and the stopping distance on wet pavement for a car traveling at 55 miles per hour. Round to the nearest foot.b. Based on your answers to part (a), which rectangular coordinate graph shows stopping distances on dry pavement and which shows stopping distances on wet pavement?c. How well do your answers to part (a) model the actual stopping distances shown in Figure 3.43?
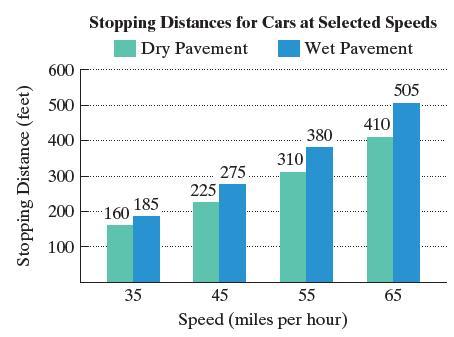 d. Determine speeds on wet pavement requiring stopping distances that exceed the length of one and one-half football fields, or 540 feet. Round to the nearest mile per hour. How is this shown on the appropriate graph of the models?
Stopping Distance (feet) 1200 1000 800 600 400 200 y Graphs of Models for Stopping Distances (b) 30 40 50 60 70 80 90 100 Speed (miles per hour) x
Step by Step Solution
3.44 Rating (157 Votes )
There are 3 Steps involved in it
a b Dry pavement graph b Wet paveme... View full answer

Get step-by-step solutions from verified subject matter experts