

The graphs show changing attitudes toward gay marriage for the period from 2001 through 2015. a. Write
Question:
The graphs show changing attitudes toward gay marriage for the period from 2001 through 2015.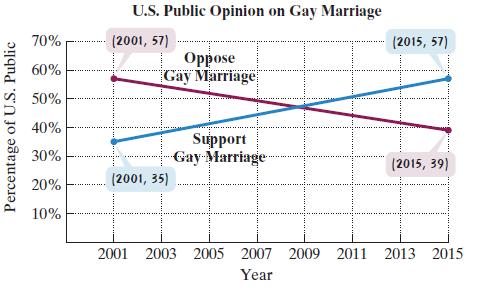
a. Write the slope-intercept equation of the line that models the percentage of the U.S. public that supported gay marriage, y, x years after 2001. Round the value of the slope, m, to one decimal place. If necessary, round the value of the y-intercept to the nearest whole number.
b. Write the slope-intercept equation of the line that models the percentage of the U.S. public that opposed gay marriage, y, x years after 2001. Round the value of the slope, m, to one decimal place. If necessary, round the value of the y-intercept to the nearest whole number.
c. Use the models from parts (a) and (b) to determine the year, to the nearest whole year, during which the percentage who supported gay marriage was the same as the percentage who opposed gay marriage.
Step by Step Answer:
a b c m 573...View the full answer


