

The graphs show per capita consumption of soda and bottled water in the United States, in gallons,
Question:
The graphs show per capita consumption of soda and bottled water in the United States, in gallons, from 2000 through 2015.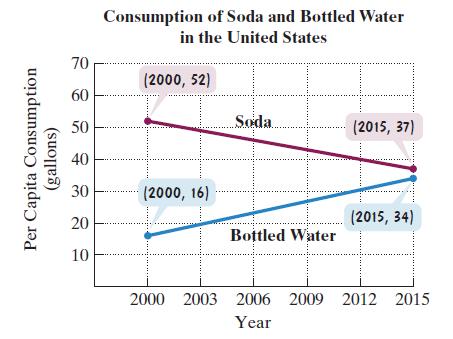
a. Write the slope-intercept equation of the line that models soda consumption per capita, y, in gallons, x years after 2000.
b. Write the slope-intercept equation of the line that models bottled water consumption per capita, y, in gallons, x years after 2000.
c. Use the models from parts (a) and (b) to determine the year, to the nearest whole year, during which per capita soda consumption was the same as per capita water consumption.
Fantastic news! We've Found the answer you've been seeking!
Step by Step Answer:
a b c m 5237 2000201515 ...View the full answer

Answered By
Palla Siva Kumar
I got my b.tech degree from IIIT, a prestigious college in India. I got AIR 514 rank in GATE exam.
0 Reviews
10+ Question Solved
Related Book For 

Question Posted:
