

we worked with data involving the increasing number of U.S. adults ages 18 and older living alone.
Question:
we worked with data involving the increasing number of U.S. adults ages 18 and older living alone. The bar graph reinforces the fact that one-person households are growing more common. It shows one-person households as a percentage of the U.S. total for five selected years from 1980 through 2012.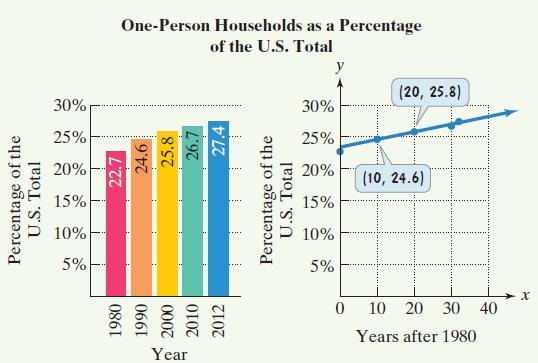 a. Shown to the right of the bar graph is a scatter plot with a line passing through two of the data points. Use the two points whose coordinates are shown by the voice balloons to write the point-slope form of an equation that models one-person households as a percentage of the U.S. total, y, x years after 1980.b. Write the equation from part (a) in slope-intercept form. Use function notation.c. If trends shown by the data continue, use the model from part (b) to project one-person households as a percentage of the U.S. total in 2020.
Step by Step Answer:
a b c According to the model 28...View the full answer


