

Question: Solve each problem. College Enrollments The graph shows the projections in total enrollment at degree granting institutions from fall 2014 to fall 2021. The following
Solve each problem.
College Enrollments The graph shows the projections in total enrollment at degree granting institutions from fall 2014 to fall 2021.
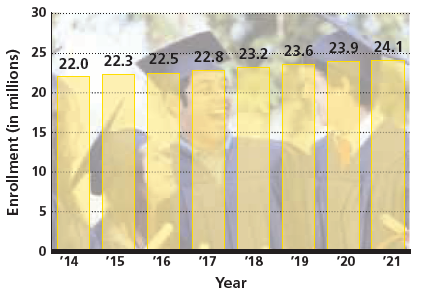
The following linear model provides the approximate enrollment, in millions, between the years 2014 and 2021, where x = 0 corresponds to 2014, x = 1 to 2015, and so on, and y is in millions of students. y = 0.3143 x + 21.95
(a) Use the model to determine projected enrollment for fall 2018.
(b) Use the model to determine the year in which enrollment is projected to reach 24 million.
(c) How do your answers to parts (a) and (b) compare to the corresponding values shown in the graph?
(d) The actual enrollment in fall 2000 was 15.3 million. The model here is based on data from 2014 to 2021. If we were to use the model for 2000, what would the projected enrollment be?
(e) Compare the actual value and the value based on the model in part (d). Discuss the pitfalls of using the model to predict enrollment for years preceding 2014.
30 25 22.0 22.3 22:5 22:8 23:2 23.6. 23.9 24.1 20 15 10 .... '14 '15 '16 '17 '18 '19 '20 '21 Year Enrollment (in millions)
Step by Step Solution
3.43 Rating (166 Votes )
There are 3 Steps involved in it
a In 2018 x 4 y 03143x 2195 y 031434 2195 232072 The ... View full answer

Get step-by-step solutions from verified subject matter experts