

The size of the total debt owed by the United States federal government continues to grow. In
Question:
The size of the total debt owed by the United States federal government continues to grow. In fact, according to the Department of the Treasury, the debt per person living in the United States is approximately $63,720 (or over $172,000 per U.S. household). The following data represent the U.S. debt for the years 2007–2017. Since the debt D depends on the year y, and each input corresponds to exactly one output, the debt is a function of the year. So D(y) represents the debt for each year y.
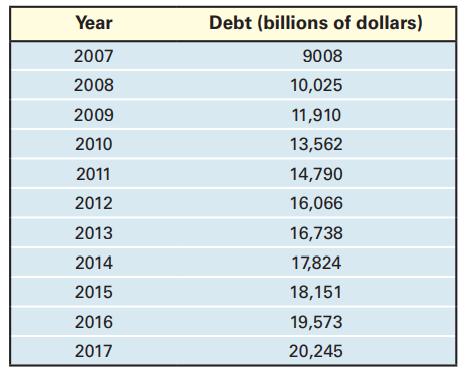
(a) Plot the points (2007, 9008), (2008, 10 025), and so on.
(b) Draw a line segment from the point (2007, 9008) to (2012, 16 066). What does the slope of this line segment represent? (c) Find the average rate of change of the debt from 2008 to 2010.
(d) Find the average rate of change of the debt from 2011 to 2013.
(e) Find the average rate of change of the debt from 2014 to 2016.
(f) What appears to be happening to the average rate of change as time passes?
Step by Step Answer:
a b c d e f Deb...View the full answer


