

Question: Consider how Pine Valley, a popular ski resort, could use capital budgeting to decide whether the $8.5 million Brook Park Lodge expansion would be


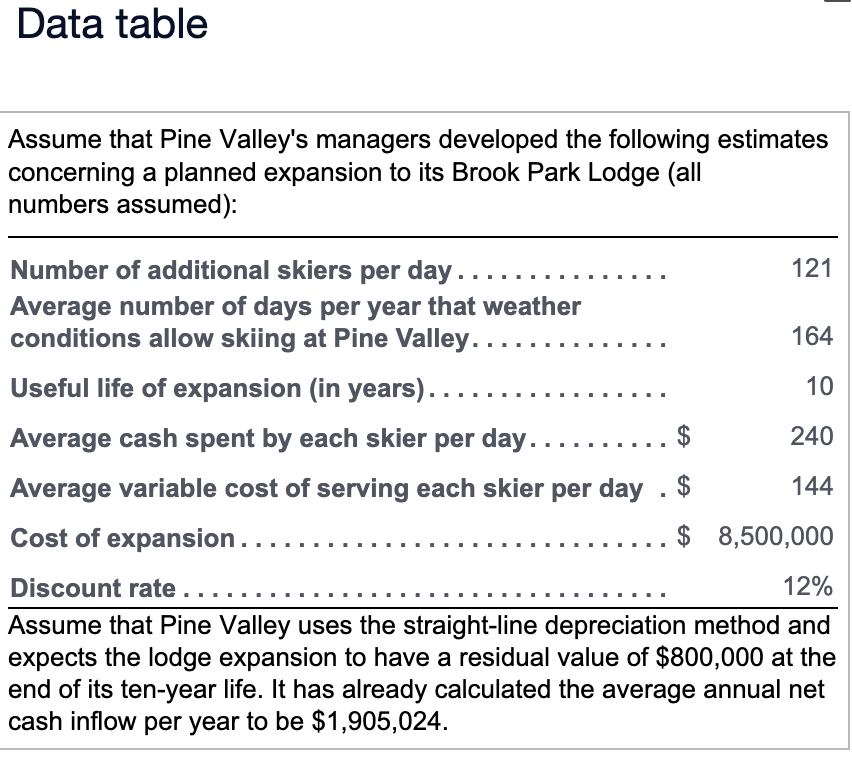
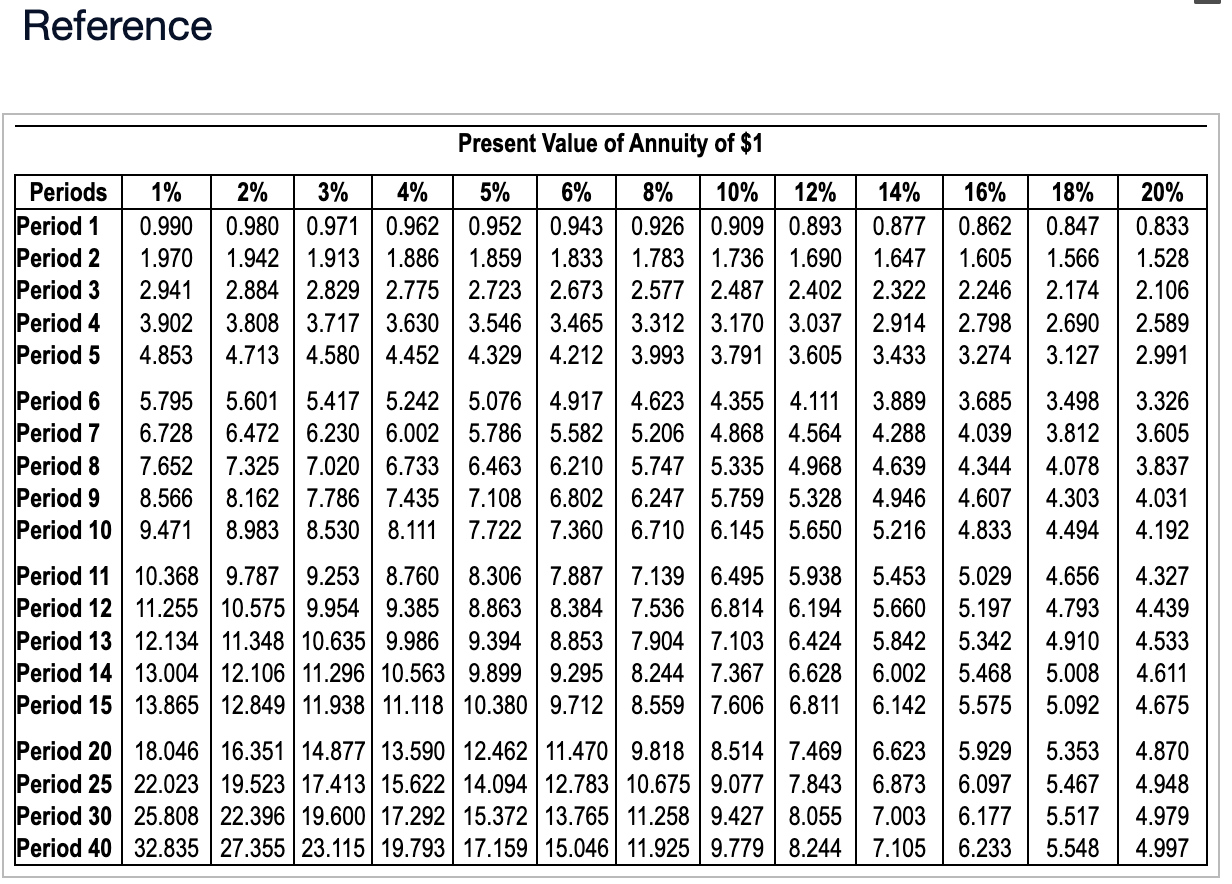
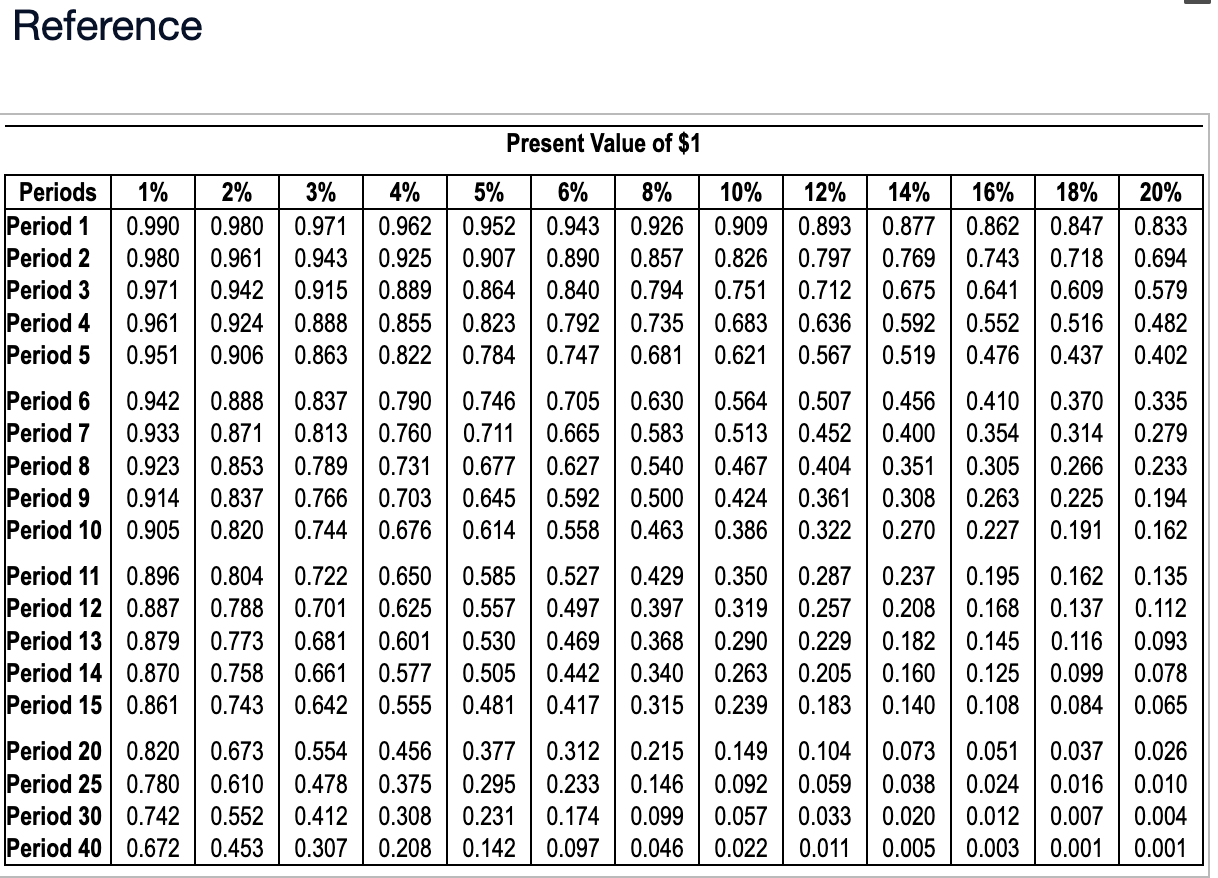
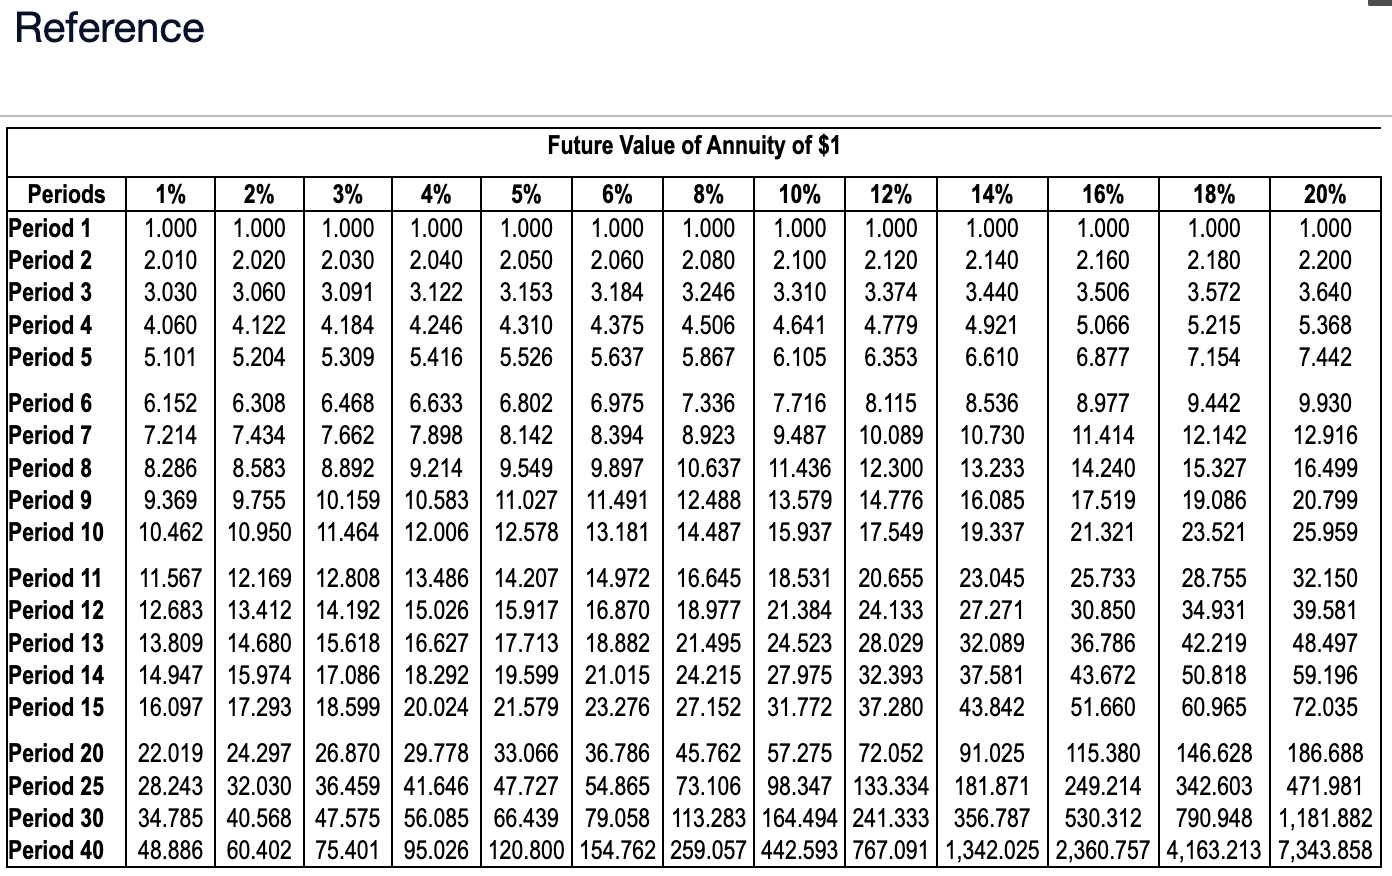
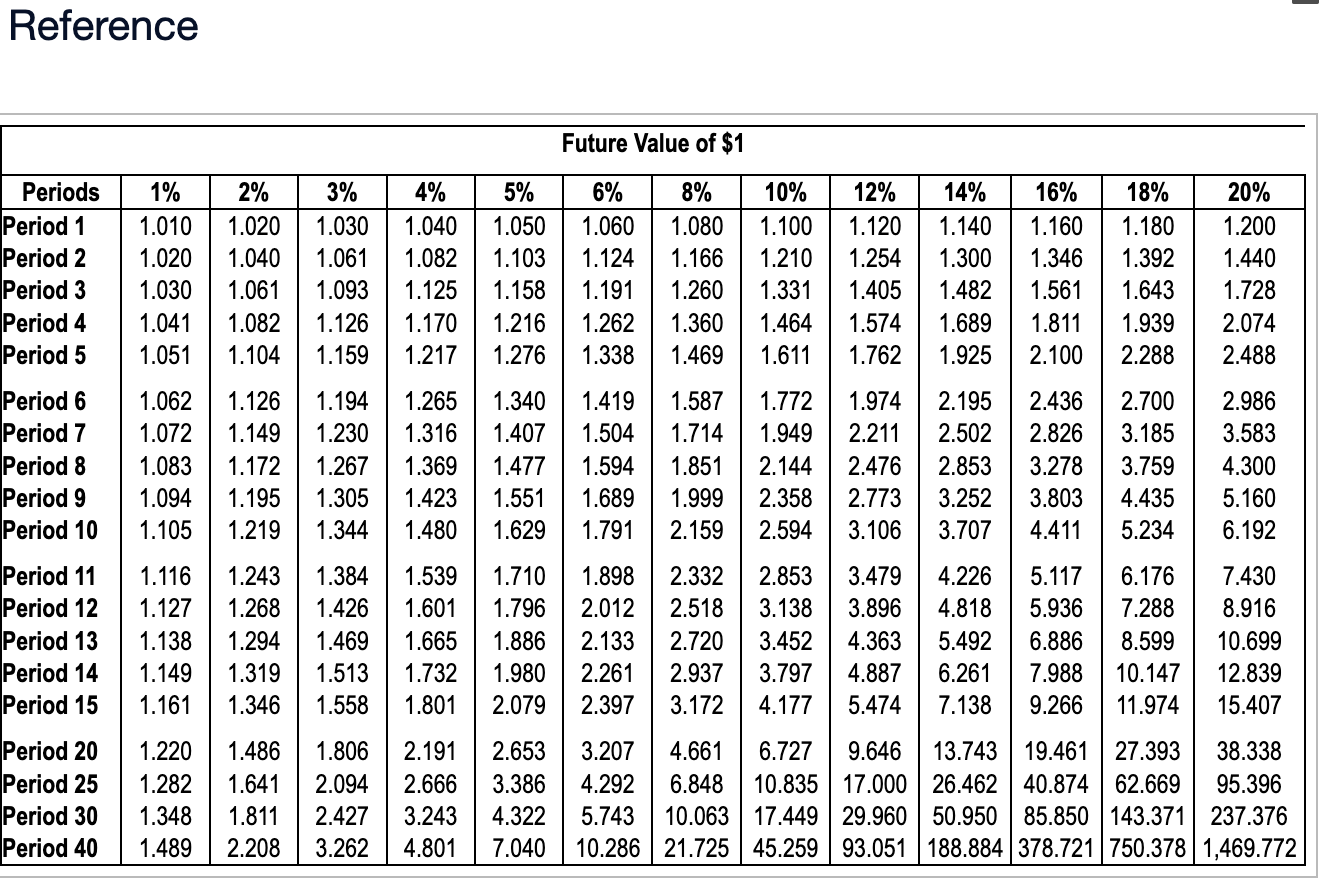

Consider how Pine Valley, a popular ski resort, could use capital budgeting to decide whether the $8.5 million Brook Park Lodge expansion would be a good investment. (Click the icon to view the expansion estimates.) (Click the icon to view the present value annuity factor table.) (Click the icon to view the future value annuity factor table.) Read the requirements. (Click the icon to view the present value factor table.) (Click the icon to view the future value factor table.) Requirement 1. What is the project's NPV? Is the investment attractive? Why or why not? Calculate the net present value of the expansion. (Round your answer to the nearest whole dollar. Use parentheses or a minus sign for a negative net present value.) Net present value of expansion Data table Assume that Pine Valley's managers developed the following estimates concerning a planned expansion to its Brook Park Lodge (all numbers assumed): Number of additional skiers per day.. Average number of days per year that weather conditions allow skiing at Pine Valley.. Useful life of expansion (in years)..... Average cash spent by each skier per day... Average variable cost of serving each skier per day . $ Cost of expansion..... ... $ 8,500,000 Discount rate..... 12% Assume that Pine Valley uses the straight-line depreciation method and expects the lodge expansion to have a residual value of $800,000 at the end of its ten-year life. It has already calculated the average annual net cash inflow per year to be $1,905,024. 121 164 10 240 144 Reference Present Value of Annuity of $1 Periods 1% 2% 3% 4% 5% 6% 8% 14% 16% 18% 10% 12% 0.909 0.893 0.877 Period 1 0.990 0.980 0.971 0.962 0.952 0.943 0.862 0.847 0.926 1.783 1.736 1.690 Period 2 1.970 1.859 1.833 1.605 1.566 1.942 1.913 1.886 2.884 2.829 2.775 Period 3 1.647 2.941 2.723 2.673 2.577 2.487 2.402 2.322 2.246 3.902 3.808 3.717 3.630 3.546 3.465 3.312 3.170 3.037 2.914 2.798 4.853 4.713 4.580 4.452 4.329 4.212 3.993 3.791 3.605 3.433 2.690 3.274 3.127 Period 4 Period 5 Period 6 Period 7 Period 8 Period 9 Period 10 5.601 5.417 3.889 3.685 3.498 6.472 6.230 4.288 4.039 3.812 7.325 5.242 5.076 4.917 4.623 4.355 4.111 6.002 5.786 5.582 5.206 4.868 4.564 7.020 6.733 6.463 6.210 5.747 5.335 4.968 4.639 4.344 4.078 8.162 7.786 7.435 7.108 6.802 6.247 5.759 5.328 4.946 4.607 4.303 8.983 8.530 8.111 7.722 7.360 6.710 6.145 5.650 5.216 4.833 4.494 Period 11 10.368 9.787 9.253 8.760 8.306 7.887 7.139 6.495 5.938 Period 12 11.255 10.575 9.954 9.385 8.863 8.384 7.536 Period 13 12.134 11.348 10.635 9.986 9.394 8.853 7.904 Period 14 13.004 12.106 11.296 10.563 9.899 9.295 8.244 Period 15 13.865 12.849 11.938 11.118 10.380 9.712 8.559 Period 20 18.046 16.351 14.877 13.590 12.462 11.470 9.818 8.514 7.469 6.623 Period 25 22.023 19.523 17.413 15.622 14.094 | 12.783 10.675 9.077 7.843 6.873 Period 30 25.808 22.396 19.600 17.292 15.372 13.765 11.258 9.427 8.055 7.003 Period 40 32.835 27.355 23.115 19.793 17.159 15.046 11.925 9.779 8.244 7.105 6.814 6.194 5.660 5.197 4.793 7.103 6.424 5.842 5.342 4.910 7.367 6.628 6.002 5.468 5.008 7.606 6.811 6.142 5.575 5.092 20% 0.833 1.528 2.174 2.106 2.589 2.991 5.795 6.728 7.652 8.566 9.471 3.326 3.605 3.837 4.031 4.192 5.453 5.029 4.656 4.327 4.439 5.353 5.929 6.097 5.467 6.177 5.517 6.233 5.548 4.533 4.611 4.675 4.870 4.948 4.979 4.997 Reference Periods 1% Period 1 0.990 Period 2 Period 3 Period 4 Period 5 Period 6 Period 7 Period 8 Period 9 Period 10 2% 3% 4% 5% 0.980 0.971 0.962 0.952 0.907 0.980 0.961 0.943 0.925 0.971 0.942 0.915 0.889 0.864 0.961 0.924 0.888 0.855 0.823 0.951 0.906 0.863 0.822 0.784 Present Value of $1 6% 8% 10% 12% 0.943 0.926 0.909 0.893 0.890 0.857 0.826 0.797 0.794 0.751 0.712 0.681 0.621 0.567 0.840 0.792 0.735 0.683 0.636 0.747 0.746 0.705 0.630 0.564 0.711 0.665 0.583 0.513 0.677 0.627 0.540 0.467 0.500 0.424 0.463 0.386 0.429 0.350 0.287 0.237 0.397 0.319 0.257 0.208 0.368 0.290 0.229 0.182 0.340 0.263 0.205 0.160 0.315 0.239 0.183 0.140 0.942 0.888 0.837 0.790 0.933 0.871 0.813 0.760 0.853 0.789 0.731 0.766 0.703 0.645 0.592 0.820 0.744 0.676 0.614 0.558 0.837 0.923 0.914 0.905 Period 11 0.896 0.804 0.722 Period 12 0.887 0.788 0.701 0.625 0.879 0.773 0.681 Period 13 Period 14 0.870 0.758 0.661 0.577 Period 15 0.861 0.743 0.642 0.555 0.650 0.585 0.527 0.557 0.497 0.601 0.530 0.469 0.505 0.442 0.481 0.417 Period 20 0.820 0.673 0.554 0.456 0.377 Period 25 0.780 0.610 0.478 0.375 0.295 Period 30 0.552 0.412 0.308 0.231 0.742 Period 40 0.672 0.453 0.307 0.208 0.142 0.312 0.233 0.174 0.097 14% 16% 18% 20% 0.877 0.862 0.847 0.833 0.743 0.718 0.694 0.769 0.675 0.641 0.609 0.579 0.592 0.552 0.516 0.482 0.519 0.476 0.437 0.402 0.507 0.456 0.410 0.370 0.452 0.400 0.354 0.314 0.404 0.351 0.305 0.266 0.361 0.308 0.263 0.225 0.322 0.270 0.227 0.191 0.195 0.162 0.135 0.168 0.137 0.112 0.145 0.116 0.093 0.125 0.099 0.078 0.108 0.084 0.065 0.215 0.149 0.104 0.073 0.146 0.092 0.059 0.038 0.099 0.057 0.033 0.020 0.046 0.022 0.011 0.005 0.335 0.279 0.233 0.194 0.162 0.051 0.037 0.026 0.024 0.016 0.010 0.012 0.007 0.004 0.003 0.001 0.001 Reference Periods 1% Period 1 Period 2 Period 3 Period 4 Period 5 Period 6 Period 7 Period 8 Period 9 Period 10 Period 11 Period 12 Period 13 Period 14 Period 15 Period 20 Period 25 Period 30 Period 40 2% 1.000 1.000 1.000 2.010 2.020 2.030 4.060 3.030 3.060 3.091 4.122 4.184 5.204 5.309 5.101 Future Value of Annuity of $1 3% 4% 5% 6% 1.000 1.000 1.000 2.040 2.050 2.060 3.122 3.153 3.184 4.246 4.310 4.375 5.416 5.526 5.637 14% 16% 18% 1.000 1.000 1.000 2.120 2.140 2.160 2.180 3.440 3.506 3.572 4.779 4.921 5.066 6.353 6.610 6.877 6.802 6.975 8.142 8.394 12% 8% 10% 1.000 1.000 1.000 2.080 2.100 3.246 3.310 3.374 4.506 4.641 5.867 6.105 6.152 6.308 6.468 6.633 7.336 7.716 8.115 8.536 8.977 7.214 7.434 7.662 7.898 8.286 8.583 8.892 9.214 14.240 8.923 9.487 10.089 10.730 11.414 9.549 9.897 10.637 11.436 12.300 13.233 9.369 9.755 10.159 10.583 11.027 11.491 12.488 13.579 14.776 16.085 17.519 10.462 10.950 11.464 12.006 12.578 13.181 14.487 15.937 17.549 5.215 7.154 20% 1.000 2.200 3.640 5.368 7.442 9.442 9.930 12.142 12.916 15.327 16.499 19.086 20.799 19.337 21.321 23.521 25.959 42.219 50.818 11.567 12.169 12.808 13.486 14.207 14.972 16.645 18.531 20.655 23.045 25.733 12.683 13.412 14.192 15.026 15.917 16.870 18.977 21.384 24.133 27.271 30.850 13.809 14.680 15.618 16.627 17.713 18.882 21.495 24.523 28.029 32.089 36.786 14.947 15.974 17.086 18.292 19.599 | 21.015| 24.215 27.975 32.393 37.581 43.672 16.097 17.293 18.599 20.024 21.579 23.276 27.152 31.772 37.280 43.842 22.019 24.297 26.870 29.778 33.066 36.786 45.762 57.275 72.052 91.025 28.243 32.030 36.459 41.646 47.727 54.865 73.106 98.347 133.334 181.871 34.785 56.085 66.439 79.058 113.283 164.494 241.333 356.787 530.312 790.948 1,181.882 48.886 60.402 75.401 95.026 120.800 154.762 259.057 442.593 767.091 1,342.025 2,360.757 4,163.213 7,343.858 51.660 60.965 115.380 146.628 186.688 249.214 342.603 471.981 40.568 47.575 28.755 32.150 34.931 39.581 48.497 59.196 72.035 Reference Periods 1% Period 1 Period 2 Period 3 Period 4 Period 5 Period 6 Period 7 Period 8 Period 9 Period 10 Period 11 Period 12 Period 13 Period 14 Period 15 Period 20 Period 25 Period 30 Period 40 2% 3% 4% 1.010 1.020 1.030 1.040 1.020 1.040 1.061 1.082 1.030 1.061 1.093 1.125 1.041 1.082 1.126 1.170 1.216 1.217 1.276 1.051 1.104 1.159 1.062 1.126 1.194 1.072 1.149 1.230 1.316 1.407 1.083 1.172 1.267 1.369 1.477 1.195 1.305 1.423 1.219 1.344 1.480 1.094 1.105 1.116 1.127 1.138 1.149 1.161 Future Value of $1 5% 8% 10% 12% 14% 16% 18% 1.140 1.160 1.180 1.300 1.346 1.392 6% 1.050 1.060 1.080 1.100 1.120 1.103 1.124 1.166 1.210 1.254 1.158 1.191 1.260 1.331 1.405 1.482 1.262 1.360 1.464 1.574 1.689 1.811 1.338 1.469 1.611 1.561 1.643 1.939 1.762 1.925 2.100 2.288 1.220 1.486 1.282 1.641 1.348 1.811 1.489 2.208 1.265 1.340 1.419 1.587 1.772 1.504 1.714 1.949 1.594 1.851 2.144 1.551 1.689 1.999 1.629 1.791 2.159 1.806 2.191 2.094 2.666 2.427 3.243 3.262 4.801 1.974 2.195 2.436 2.211 2.502 2.826 1.243 1.384 1.539 1.710 1.898 2.332 2.853 3.479 1.268 1.426 1.601 1.796 2.012 2.518 3.138 3.896 1.294 1.469 1.665 1.886 2.133 2.720 3.452 1.732 1.980 2.261 2.937 3.797 1.558 1.801 2.079 2.397 3.172 4.177 5.474 1.319 1.513 1.346 2.653 3.386 4.322 7.040 2.700 2.986 3.185 3.583 4.300 2.853 3.278 3.759 3.803 4.435 5.160 4.411 5.234 6.192 3.252 3.707 4.226 5.117 6.176 7.430 4.818 5.936 7.288 8.916 4.363 5.492 6.886 8.599 10.699 12.839 4.887 6.261 7.988 10.147 7.138 9.266 11.974 15.407 2.476 2.358 2.773 2.594 3.106 20% 1.200 1.440 1.728 2.074 2.488 3.207 4.661 13.743 19.461 27.393 38.338 6.727 9.646 6.848 10.835 17.000 4.292 26.462 40.874 62.669 95.396 10.063 17.449 29.960 50.950 85.850 143.371 237.376 5.743 10.286 21.725 45.259 93.051 188.884 378.721 750.378 1,469.772 Requirements 1. What is the project's NPV? Is the investment attractive? Why or why not? 2. Assume the expansion has no residual value. What is the project's NPV? Is the investment still attractive? Why or why not?
Step by Step Solution
3.38 Rating (154 Votes )
There are 3 Steps involved in it

Get step-by-step solutions from verified subject matter experts