

Table 13 lists fall graduate enrollment by gender in U.S. degree granting institutions. The figure contains a
Question:
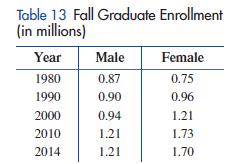
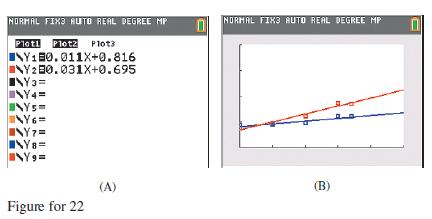
Table 13 lists fall graduate enrollment by gender in U.S. degree granting institutions. The figure contains a scatter plot and regression line for each data set, where x represents years since 1980 and y represents enrollment (in millions).
(A) Interpret the slope of each model.
(B) Use the regression models to predict the male and female graduate enrollments in 2025.
(C) Use the regression models to estimate the first year in which female graduate enrollment will exceed male graduate enrollment by at least 1 million.
Fantastic news! We've Found the answer you've been seeking!
Step by Step Answer:
Male graduate enrollment y 0011x 0816 female graduate enrollment y 0031x0695 A Graduate male enroll...View the full answer

Answered By
Mario Alvarez
I teach Statistics and Probability for students of my university ( Univerisity Centroamerican Jose Simeon Canas) in my free time and when students ask for me, I prepare and teach students that are in courses of Statistics and Probability. Also I teach students of the University Francisco Gavidia and Universidad of El Salvador that need help in some topics about Statistics, Probability, Math, Calculus. I love teaching Statistics and Probability! Why me?
** I have experience in Statistics and Probability topics for middle school, high school and university.
** I always want to share my knowledge with my students and have a great relationship with them.
** I have experience working with students online.
** I am very patient with my students and highly committed with them
1+ Reviews
10+ Question Solved
Related Book For 

College Mathematics For Business Economics, Life Sciences, And Social Sciences
ISBN: 978-0134674148
14th Edition
Authors: Raymond Barnett, Michael Ziegler, Karl Byleen, Christopher Stocker
Question Posted:
