

Question: Figure 2.72 shows the data and regression line for using abdomen circumference to predict body fat percentage. Figure 2.72 (a) Which scatterplot, the one using
Figure 2.72 shows the data and regression line for using abdomen circumference to predict body fat percentage.
Figure 2.72
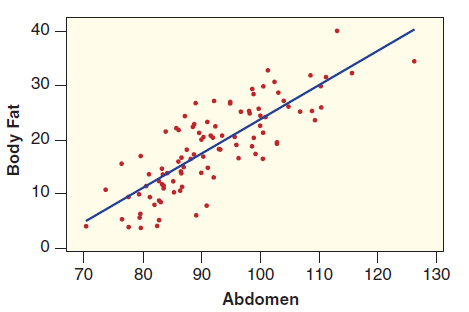
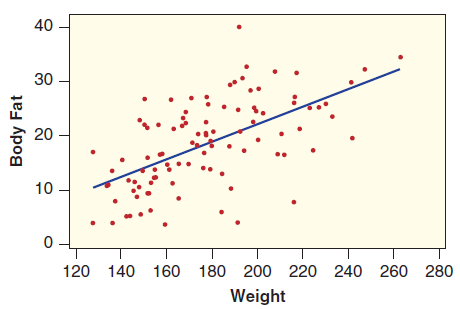
(a) Which scatterplot, the one using Weight in Figure 2.71 or the one using Abdomen in Figure 2.72, appears to contain data with a larger correlation?
Figure 2.71
(b) In Figure 2.72, one person has a very large abdomen circumference of about 127 cm. Estimate the actual body fat percent for this person as well as the predicted body fat percent.
(c) Use Figure 2.72 to estimate the abdomen circumference for the person with about 40% body fat. In addition, estimate the residual for this person.
Use the dataset BodyFat, which gives the percent of weight made up of body fat for 100 men as well as other variables such as Age, Weight (in pounds), Height (in inches), and circumference (in cm) measurements for the Neck, Chest, Abdomen, Ankle, Biceps, and Wrist.
40 30 - 10 80 90 70 100 110 120 130 Abdomen Body Fat 40 20 10 120 140 160 180 200 220 240 260 280 Weight Body Fat
Step by Step Solution
3.52 Rating (166 Votes )
There are 3 Steps involved in it
a There is a stronger positive linear trend and therefore a larger correlation in the o... View full answer

Get step-by-step solutions from verified subject matter experts