

(a) Explain how you can use the graph of position versus time in Figure 2.52 to describe...
Question:
(a) Explain how you can use the graph of position versus time in Figure 2.52 to describe the change in velocity over time. Identify
(b) The time (ta, tb, tc, td, or te) at which the instantaneous velocity is greatest,
(c) The time at which it is zero, and
(d) The time at which it is negative.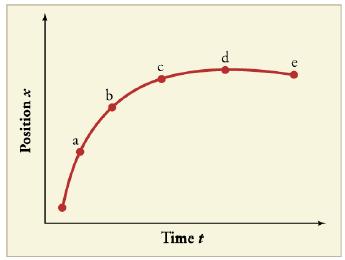
Fantastic news! We've Found the answer you've been seeking!
Step by Step Answer:
a The graph of position versus time shows how the position of an object changes ov...View the full answer

Answered By
Carly Cimino
As a tutor, my focus is to help communicate and break down difficult concepts in a way that allows students greater accessibility and comprehension to their course material. I love helping others develop a sense of personal confidence and curiosity, and I'm looking forward to the chance to interact and work with you professionally and better your academic grades.
12+ Reviews
21+ Question Solved
Related Book For 
Question Posted:
