

Find the average velocity of the car whose position is graphed in Figure 2.45. Data given in
Question:
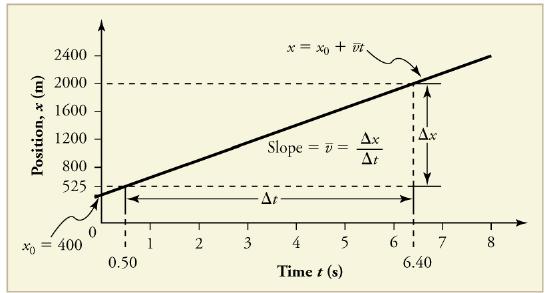
Find the average velocity of the car whose position is graphed in Figure 2.45.
Data given in Figure 2.45
Strategy
The slope of a graph of x vs. t is average velocity, since slope equals rise over run. In this case, rise = change in position and run = change in time, so that
Since the slope is constant here, any two points on the graph can be used to find the slope. (Generally speaking, it is most accurate to use two widely separated points on the straight line. This is because any error in reading data from the graph is proportionally smaller if the interval is larger.)
Fantastic news! We've Found the answer you've been seeking!
Step by Step Answer:
1 Choose two points on the line In this case we choose t...View the full answer

Answered By
Tobias sifuna
I am an individual who possesses a unique set of skills and qualities that make me well-suited for content and academic writing. I have a strong writing ability, allowing me to communicate ideas and arguments in a clear, concise, and effective manner. My writing is backed by extensive research skills, enabling me to gather information from credible sources to support my arguments. I also have critical thinking skills, which allow me to analyze information, draw informed conclusions, and present my arguments in a logical and convincing manner. Additionally, I have an eye for detail and the ability to carefully proofread my work, ensuring that it is free of errors and that all sources are properly cited. Time management skills are another key strength that allow me to meet deadlines and prioritize tasks effectively. Communication skills, including the ability to collaborate with others, including editors, peer reviewers, and subject matter experts, are also important qualities that I have. I am also adaptable, capable of writing on a variety of topics and adjusting my writing style and tone to meet the needs of different audiences and projects. Lastly, I am driven by a passion for writing, which continually drives me to improve my skills and produce high-quality work.
1+ Reviews
10+ Question Solved
Related Book For 

Question Posted:
