

Question: Figure P2.53 shows the position as a function of time for an object. (a) What is the average velocity during the period from t =
Figure P2.53 shows the position as a function of time for an object.
(a) What is the average velocity during the period from t = 0.0 s to t = 10.0 s?
(b) What is the average velocity between t = 0.0 s and t = 5.0 s?
(c) Between t = 5.0 s and t = 10.0 s?
(d) Explain why and how your answers to parts (a), (b), and (c) are related.
Figure P2.53
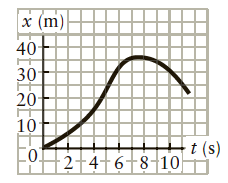
(m) 40 30 20 10 t (s) -0H2+4+6+8-10
Step by Step Solution
★★★★★
3.43 Rating (182 Votes )
There are 3 Steps involved in it
1 Expert Approved Answer
Step: 1 Unlock

Apply graphical analysis of motion specifically the definition of average velocity No sketch needed ... View full answer
Question Has Been Solved by an Expert!
Get step-by-step solutions from verified subject matter experts
Step: 2 Unlock
Step: 3 Unlock