

Figure Q2.24 shows a motion diagram with the clock reading (in seconds) shown at each position. From
Question:
Figure Q2.24 shows a motion diagram with the clock reading (in seconds) shown at each position. From \(t=9 \mathrm{~s}\) to \(t=15 \mathrm{~s}\) the object is at the same position. After that, it returns along the same track. The positions of the dots for \(t \geq 16 \mathrm{~s}\) are offset for clarity. Which graph best represents the object's velocity?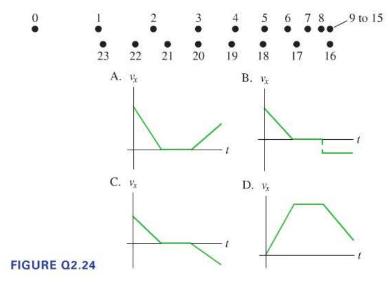
Fantastic news! We've Found the answer you've been seeking!
Step by Step Answer:

Answered By
Muhammad Rehan
Enjoy testing and can find bugs easily and help improve the product quality.
10+ Reviews
10+ Question Solved
Related Book For 

College Physics A Strategic Approach
ISBN: 9780321907240
3rd Edition
Authors: Randall D. Knight, Brian Jones, Stuart Field
Question Posted:
