

A graph is plotted of the vertical velocity component vy of an elevator versus time. The y-axis
Question:
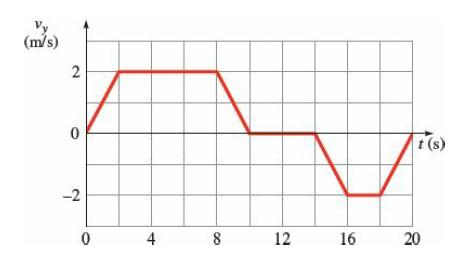
A graph is plotted of the vertical velocity component vy of an elevator versus time. The y-axis points up.
(a) How high is the elevator above the starting point (t = 0) after 20 s have elapsed?
(b) When is the elevator at its highest location above the starting point?
(c) Describe the motion in words.
(d) Sketch a graph of y(t).
Step by Step Answer:

This question has not been answered yet.
You can Ask your question!
Related Book For 

College Physics With An Integrated Approach To Forces And Kinematics
ISBN: 978-1260547719
5th Edition
Authors: Alan Giambattista
Question Posted:
