

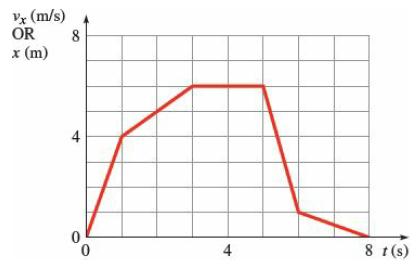
The graph shows v x in meters per second versus t in seconds for a skateboard moving
Question:
The graph shows vx in meters per second versus t in seconds for a skateboard moving along the x-axis. How far does the board move between t = 3.00 s and t = 8.00 s? Sketch a motion diagram and a graph of x(t) for the same time interval.
Step by Step Answer:

This question has not been answered yet.
You can Ask your question!
Related Book For 

College Physics With An Integrated Approach To Forces And Kinematics
ISBN: 978-1260547719
5th Edition
Authors: Alan Giambattista
Question Posted:
