

Question: The graph with Problem 23 shows speedometer readings as a car skids to a stop on a straight roadway. What is the magnitude of the
The graph with Problem 23 shows speedometer readings as a car skids to a stop on a straight roadway. What is the magnitude of the acceleration at t = 7.0 s? Sketch a graph of ax(t). What is the coefficient of kinetic friction?
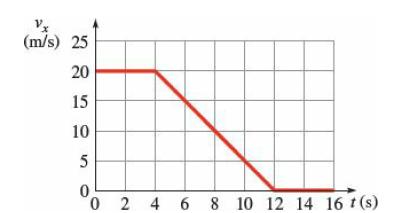
(m/s) 25 20 15 10 5 O 2 4 6 8 10 12 14 16 t(s)
Step by Step Solution
★★★★★
3.37 Rating (163 Votes )
There are 3 Steps involved in it
1 Expert Approved Answer
Step: 1 Unlock

Question Has Been Solved by an Expert!
Get step-by-step solutions from verified subject matter experts
Step: 2 Unlock
Step: 3 Unlock