

The phase diagram for water is shown in the figure. If the temperature of a certain amount
Question:
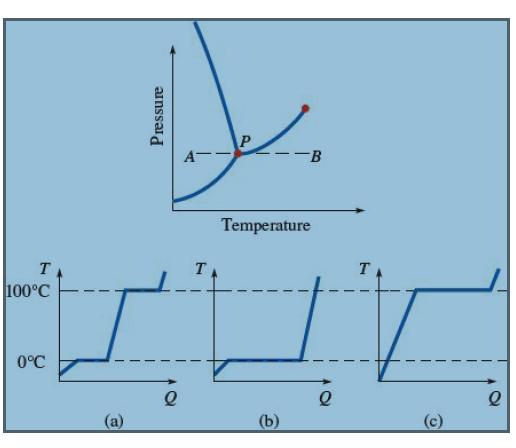
The phase diagram for water is shown in the figure. If the temperature of a certain amount of ice is increased by following the path represented by the horizontal dashed line from A to B through point P, which of the graphs of temperature as a function of heat added is correct?
Fantastic news! We've Found the answer you've been seeking!
Step by Step Answer:

Answered By
Branice Buyengo Ajevi
I have been teaching for the last 5 years which has strengthened my interaction with students of different level.
1+ Reviews
10+ Question Solved
Related Book For 

College Physics With An Integrated Approach To Forces And Kinematics
ISBN: 978-1260547719
5th Edition
Authors: Alan Giambattista
Question Posted:
