

The graph below shows how the temperature of some liquid in a beaker changed as it was
Question:
The graph below shows how the temperature of some liquid in a beaker changed as it was heated until it was boiling.
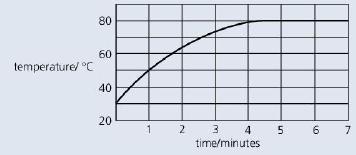
a. What was the boiling point of the liquid?
b. State and explain what difference, if any, there would be in the final temperature if the liquid was heated more strongly. c State one difference between boiling and evaporation.
Fantastic news! We've Found the answer you've been seeking!
Step by Step Answer:
a The boiling point of the liquid appears to be around 100C b If the liquid was heated more strongly ...View the full answer

Answered By
Akshay Shete
I have extensive experience as a tutor, both online and in-person. I have worked with students of all ages and abilities, and am skilled at adapting my teaching style to meet the needs of each individual student. I have a strong background in a variety of subjects, including math, science, and English, and am able to break down complex concepts in a way that is easy for students to understand. In addition to my subject matter expertise, I am also a patient and supportive teacher, and am committed to helping my students succeed. Whether I am working with a struggling student who needs extra help to catch up, or an advanced student looking to get ahead, I am able to provide the guidance and support they need to reach their goals. Overall, my hands-on experience as a tutor has prepared me to be a confident and effective teacher, and I am excited to use my skills to help students succeed.
0 Reviews
10+ Question Solved
Related Book For 

Question Posted:
