

The diagram shows a sketch of the curve f(x), which passes through the origin, O, and the
Question:
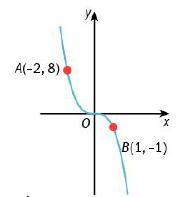
The diagram shows a sketch of the curve f(x), which passes through the origin, O, and the points A(−2, 8) and B(1, −1). On separate diagrams, sketch the graphs of
a) y = 4f(x)
b) y = f(−1/2x)
c) y = −2f(x + 1)
d) y =1+ f(−2x).
Mark the new position of the points O, A and B on each
transformation, stating their coordinates.
Fantastic news! We've Found the answer you've been seeking!
Step by Step Answer:
ANSWER a To sketch the graph of y 4fx you need to multiply the ycoordinate of every point on the cur...View the full answer

Answered By
User l_917591
As a Business Management graduate from Moi University, I had the opportunity to work as a tutor for undergraduate students in the same field. This experience allowed me to apply the theoretical knowledge I had gained in a practical setting, while also honing my teaching and communication skills.
As a tutor, I was responsible for conducting tutorial sessions, grading assignments and exams, and providing feedback and support to my students. I also assisted with the preparation of course materials and collaborated with other tutors and professors to ensure consistency in teaching and assessment.
0 Reviews
10+ Question Solved
Related Book For 

Complete Pure Mathematics 1 For Cambridge International AS & A Level
ISBN: 9780198427438
2nd Edition
Authors: Jean Linsky, Brian Western, James Nicholson
Question Posted:
