

Question: Consider the table given next, which tracks several performance indicators for Intel desktop processors since 2010. The Tech column shows the minimum feature size of
Consider the table given next, which tracks several performance indicators for Intel desktop processors since 2010.
The “Tech” column shows the minimum feature size of each processor’s fabrication process. Assume that the die size has remained relatively constant and the number of transistors that comprise each processor scales at (1/t)2, where t = the minimum feature size.
For each performance indicator, calculate the average rate of improvement from 2010 to 2019, as well as the number of years required to double each at that corresponding rate.
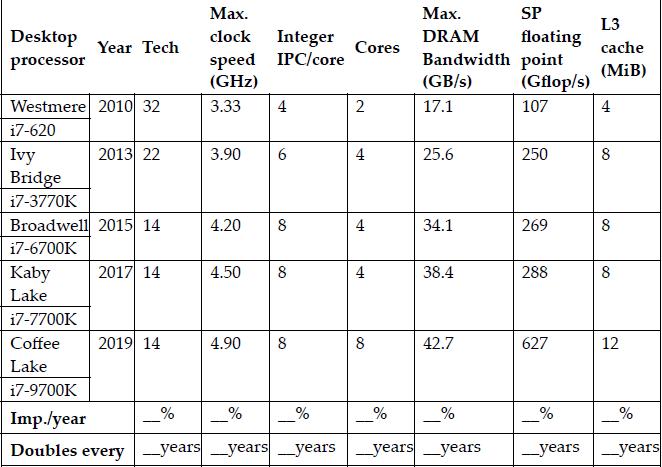
Desktop processor Year Tech Westmere 2010 32 i7-620 Ivy Bridge 17-3770K Kaby Lake 2013 22 Broadwell 2015 14 17-6700K 2017 14 17-7700K Coffee Lake 17-9700K Imp./year Doubles every 2019 14 % Max. clock Integer speed IPC/core (GHz) 3.33 4 3.90 4.20 8 6 4.50 8 4.90 8 % years years % years Cores 2 4 4 4 8 % years Max. DRAM Bandwidth point (GB/s) 17.1 25.6 34.1 38.4 42.7 % SP floating years (Gflop/s) 107 250 269 288 627 % years L3 cache (MiB) 4 8 8 8 12 % years
Step by Step Solution
3.36 Rating (152 Votes )
There are 3 Steps involved in it
The table below shows the performance indicators for Intel desktop processors since 2010 The Tech co... View full answer

Get step-by-step solutions from verified subject matter experts