

The figure below shows the age structures for the world human population in 1950 and 2010 as
Question:
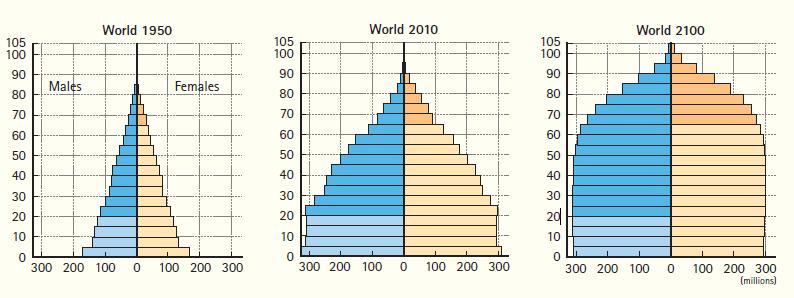
The figure below shows the age structures for the world human population in 1950 and 2010 as well as a projection for the year 2100. How did the age structure of the world population change between 1950 and 2010? How is it expected to change between 2010 and 2100?
Fantastic news! We've Found the answer you've been seeking!
Step by Step Answer:

Answered By
Joseph Mwaura
I have been teaching college students in various subjects for 9 years now. Besides, I have been tutoring online with several tutoring companies from 2010 to date. The 9 years of experience as a tutor has enabled me to develop multiple tutoring skills and see thousands of students excel in their education and in life after school which gives me much pleasure. I have assisted students in essay writing and in doing academic research and this has helped me be well versed with the various writing styles such as APA, MLA, Chicago/ Turabian, Harvard. I am always ready to handle work at any hour and in any way as students specify. In my tutoring journey, excellence has always been my guiding standard.
1+ Reviews
10+ Question Solved
Related Book For 

Conceptual Integrated Science
ISBN: 9780321818508
2nd Edition
Authors: Paul G Hewitt, Suzanne A Lyons
Question Posted:
