

Question: Create a bar graph that illustrates the differences in admission rates among the different campuses. The following are data on the admission rates of the
Create a bar graph that illustrates the differences in admission rates among the different campuses.
The following are data on the admission rates of the different branch campuses in the University of California system, along with the out-of-state tuition and fee cost:
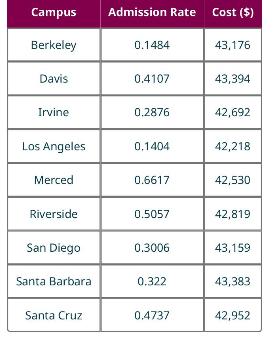
Campus Admission Rate Cost ($) Berkeley 0.1484 43,176 Davis 0.4107 43,394 Irvine 0.2876 42,692 Los Angeles 0,1404 42,218 Merced 0.6617 42,530 Riverside 0.5057 42,819 San Diego 0.3006 43,159 Santa Barbara 0.322 43,383 Santa Cruz 0.4737 42,952
Step by Step Solution
★★★★★
3.40 Rating (150 Votes )
There are 3 Steps involved in it
1 Expert Approved Answer
Step: 1 Unlock

Question Has Been Solved by an Expert!
Get step-by-step solutions from verified subject matter experts
Step: 2 Unlock
Step: 3 Unlock