

Question: Consider the hub data in Exercise 15-95. (a) Construct an EWMA control chart with λ = 0.2 and L = 3. Comment on process control.
(a) Construct an EWMA control chart with λ = 0.2 and L = 3. Comment on process control.
(b) Construct an EWMA control chart with λ = 0.5 and L = 3 and compare your conclusion to part (a).
Exercise 15-95
An article in Quality Engineering [€œIs the Process Capable? Tables and Graphs in Assessing Cpm€ (1992, Vol. 4(4)]. Considered manufacturing data. Specifications for the outer diameter of the hubs were 60.3265 ± 0.001 mm. A random sample with size n = 20 was taken and the data are shown in the following table:
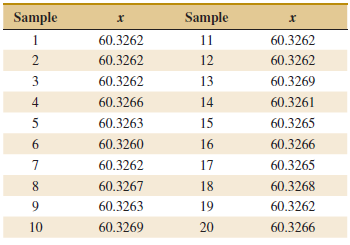
Sample Sample 60.3262 11 60.3262 60.3262 12 60.3262 60.3269 3 60.3262 13 4 60.3266 14 60.3261 5 60.3263 15 60.3265 60.3260 16 60.3266 60.3262 17 60.3265 60.3267 18 60.3268 60.3263 19 60.3262 60.3266 10 60.3269 20
Step by Step Solution
3.36 Rating (168 Votes )
There are 3 Steps involved in it
a The process appears to be in control b The ... View full answer

Get step-by-step solutions from verified subject matter experts