

Question: For the Bode plots shown in Figure P10.10, determine the transfer function by hand or via MATLAB. 40 20 -20 -40 -60 -80 10 10
For the Bode plots shown in Figure P10.10, determine the transfer function by hand or via MATLAB.
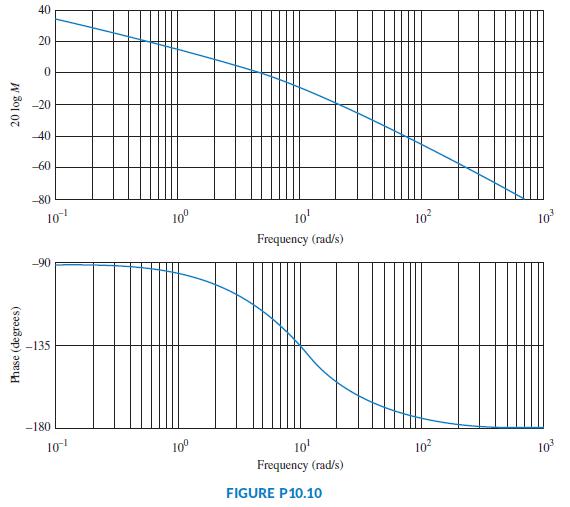
40 20 -20 -40 -60 -80 10 10 10' 10 10 Frequency (rad/s) -90 -135 -180 10 10 10' 10? 10 Frequency (rad/s) FIGURE P10.10 Phase (degrees) 20 log M
Step by Step Solution
★★★★★
3.30 Rating (153 Votes )
There are 3 Steps involved in it
1 Expert Approved Answer
Step: 1 Unlock

Question Has Been Solved by an Expert!
Get step-by-step solutions from verified subject matter experts
Step: 2 Unlock
Step: 3 Unlock