

Question: Using the data in the following table, estimate the average return and volatility for each stock. Realized Returns Year Stock A Stock B 21% 1998
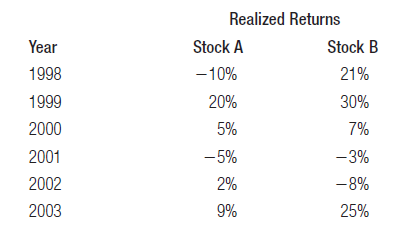
Realized Returns Year Stock A Stock B 21% 1998 -10% 1999 20% 30% 2000 5% 7% 2001 -5% -3% 2002 2% -8% 2003 9% 25%
Step by Step Solution
★★★★★
3.35 Rating (158 Votes )
There are 3 Steps involved in it
1 Expert Approved Answer
Step: 1 Unlock

Plan Calculate the expected return and volatility of Stock A and S... View full answer
Question Has Been Solved by an Expert!
Get step-by-step solutions from verified subject matter experts
Step: 2 Unlock
Step: 3 Unlock
Document Format (1 attachment)
1780_6062acf829fd9_727358.xlsx
300 KBs Excel File