

The data given below show percentages of work completed for a construction project: Graph the data in
Question:
The data given below show percentages of work completed for a construction project:
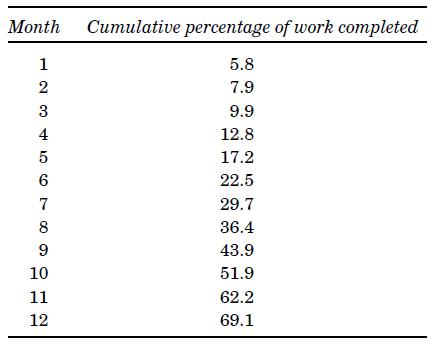
Graph the data in Excel and comment on the shapes of the distributions.
• Forecast the cumulative percentages of work completed for each of the next six months using linear regression and compute R2, r, and Syt.
• Is linear regression an appropriate forecasting method for this data? If not, can you suggest an alternative forecasting method with adequate rationale?
• Use your chosen method (other than linear regression) to forecast the percentages of work completed for months 16, 17, 18 and 19.
• Is this a better forecasting method for this data than linear regression?
Justify your answer.
Step by Step Answer:

This question has not been answered yet.
You can Ask your question!


Cost And Value Management In Projects
ISBN: 9781119933540
2nd Edition
Authors: Ray R. Venkataraman, Jeffrey K. Pinto
